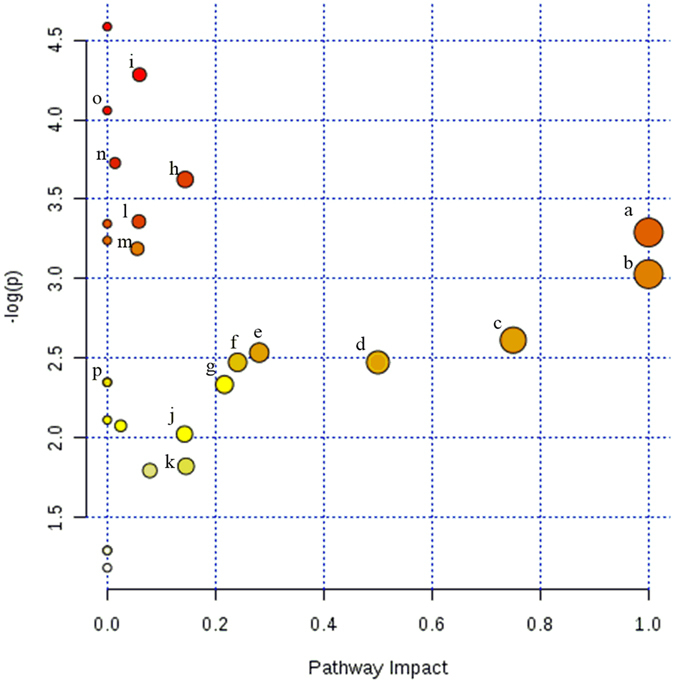
Figure 2.

Ruminal metabolomics pathway analysis by MetaboAnalyst 3.0 Software on the steers with the greatest average daily gain compare to the least ADG with similar average dry matter intake according to Bos taurus KEGG pathway database. UPLC-qTOF 90 metabolites identified to differ between ADG by t-test (P < 0.1). (a) Alpha-linolenic acid metabolism, (b) linoleic metabolism (c) taurine and hypotaurine metabolism d) phenylalanine, tyrosine and tryptophan (e) sphingolipids (f) phenylalanine (g) retinol (h) histidine (i) primary bile biosynthesis (j) glycerophospholipid (k) tyrosin (l) porphyrin and chlorophyll (m) steroid hormone biosynthesis (n) glutathione (o) Riboflavin (p) Gluconeogenesis. The darker the color and larger the size represent higher P-value from enrichment analysis and greater impact from the pathway topology analysis, respectively.
