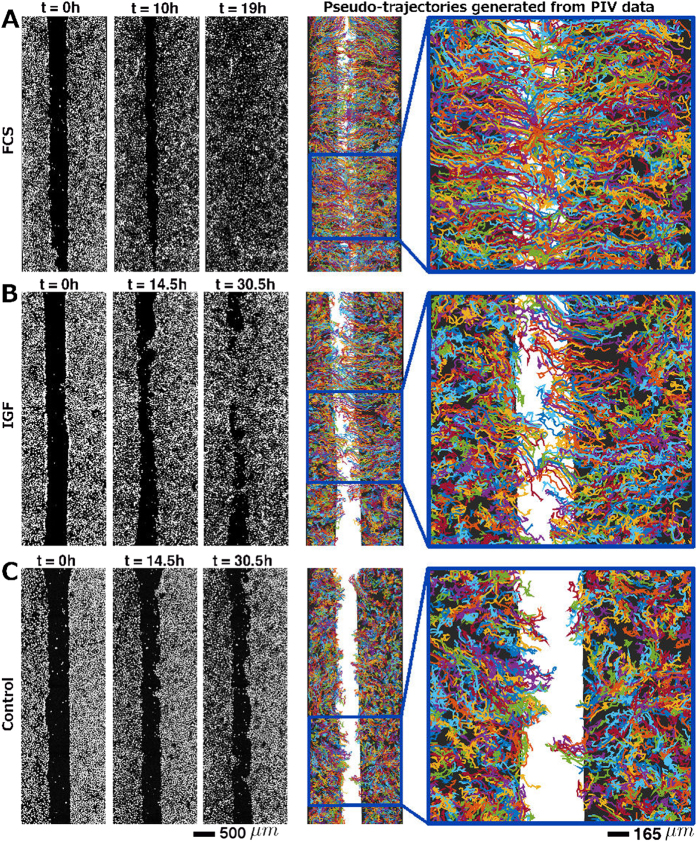
Fig. 1.
Different phenotypes of sheet migration in NSCLC H1975 cells associated with different treatments. (a) Straight front after treatment with FCS. (b) Cellular bridges after treatment with IGF. (c) Finger shapes/undulating fronts in a control experiment (no stimulation). Snapshots are showing stained nuclei at time points t = 0, 10, and 19 h (a), and at time points t = 0, 14.5, and 30.5 h (b, c). On the right, pseudo-trajectories generated from PIV data are shown for each experiment for the entire field of view and an enlarged section. Random coloring of the trajectories has been chosen for better visibility of the paths of neighboring cell groups. The pseudo-trajectories show clearly that after stimulation with FCS also bulk cells far from the front engage in directed migration towards the gap. After stimulation with (IGF)-1 cells further than 500 μm do not engage in directed migration. For unstimulated cells (c) persistent migration towards the gap is almost entirely absent. Original movies for a, b and c are provided as Supplementary Material

