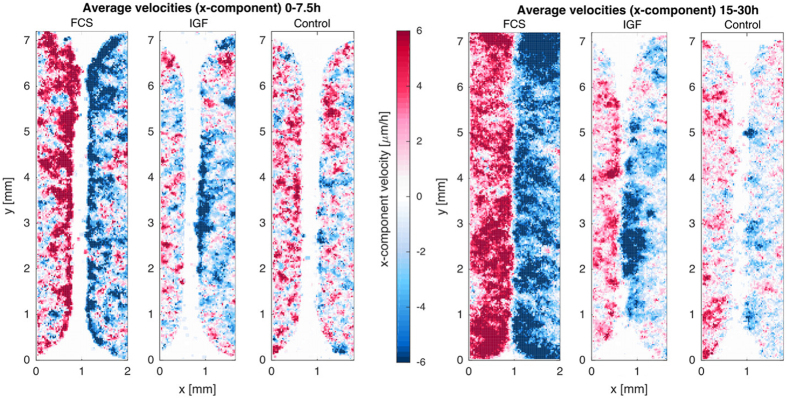
Fig. 2.
Migration activation pattern derived from PIV for the unstimulated, FCS or IGF stimulated H1975 cells displayed in Fig. 1. The activation maps show the time average of the spatially resolved x-components of the velocity field for an early time span (averaged over the first 7.5 h) (a), and a later time span (15–30 h average) (b). These maps illustrate that directed motility is first activated at the front and then back-propagates into the submarginal and bulk cells. The level of front activation and the degree to which activation spreads into the tissue is modulated by the treatment

