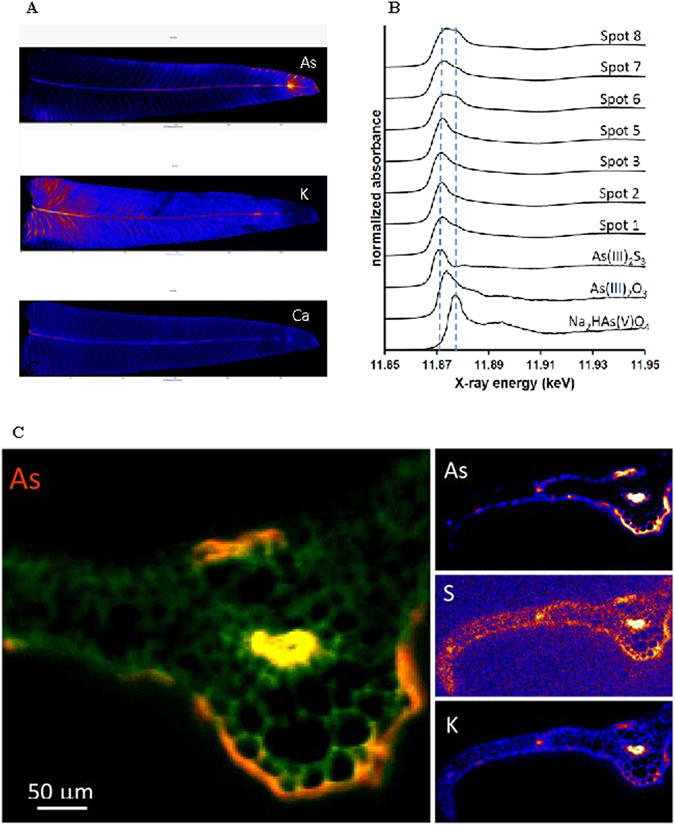
Figure 4.

(A) Synchrotron analysis of a leaflet initially treated with 6.7 mM AsV showing the distributions of As as compared to K and Ca. (B) Arsenic K-edge µ-XANES scans collected at various locations throughout the leaflet shown in 4 A (As), compared to AsV and AsIII reference spectra. The two dashed lines locate the energy positions of the edge maxima of As(III)2S3 and Na2HAs(V)O4. The location of the spots are detailed in Supplementary Information Fig. 1. (C) Synchrotron X-ray fluorescence images of As, S and K in pinna tissue cross-section (2 mm from apex) from 6.7 mM treatment showing elevated levels of As adjacent to mid-rib vein and secondary veins with preferential accumulation on abaxial (lower) surface of the pinnae.
