
Fig. 2.
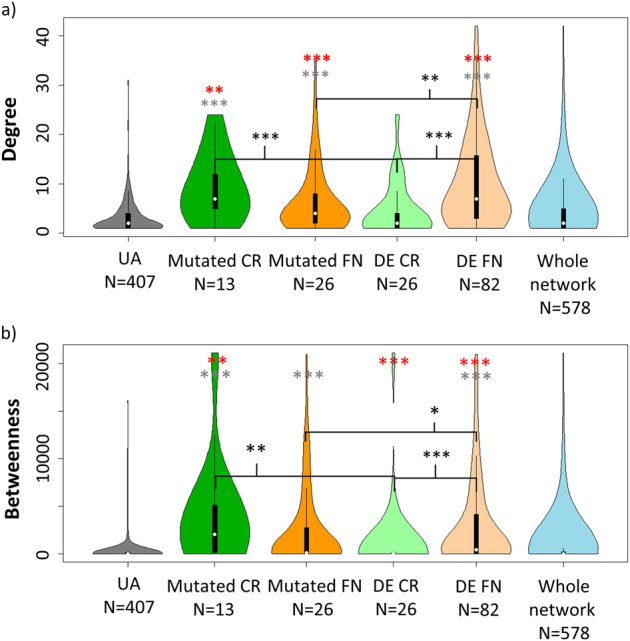
Differences between first neighbours of mutated and differentially expressed proteins in colon cancer. a,b Violin plot showing the degree and betweenness centrality of mutated or differentially expressed (DE) cancer-related (CR) proteins and their respective first neighbours (FN) to unaffected proteins (UA) or to the whole network in the signalling network of colon cancer (using the SignaLink 2 database). White dots represent the median values. Boxes stretch from the 25th percentile to the 75th percentile, while the whiskers are twice the length of the boxes. Wilcoxon rank sum tests was employed for the statistical analysis, with the unaffected proteins (grey stars) and the whole colon cancer specific network (red stars) as control. The level of significance is represented using the following scale: *p < 0.05, **p < 0.01, ***p < 0.001. The plots show that FN of DE proteins have higher network centralities than their cancer-related counterparts, meanwhile mutated CR proteins and their FN have similar centrality. Dark green—mutated CR proteins, light green—DE cancer-related proteins; orange nodes indicate the FN of mutated proteins, while light orange nodes are the FNs of DE proteins