
Fig. 5.
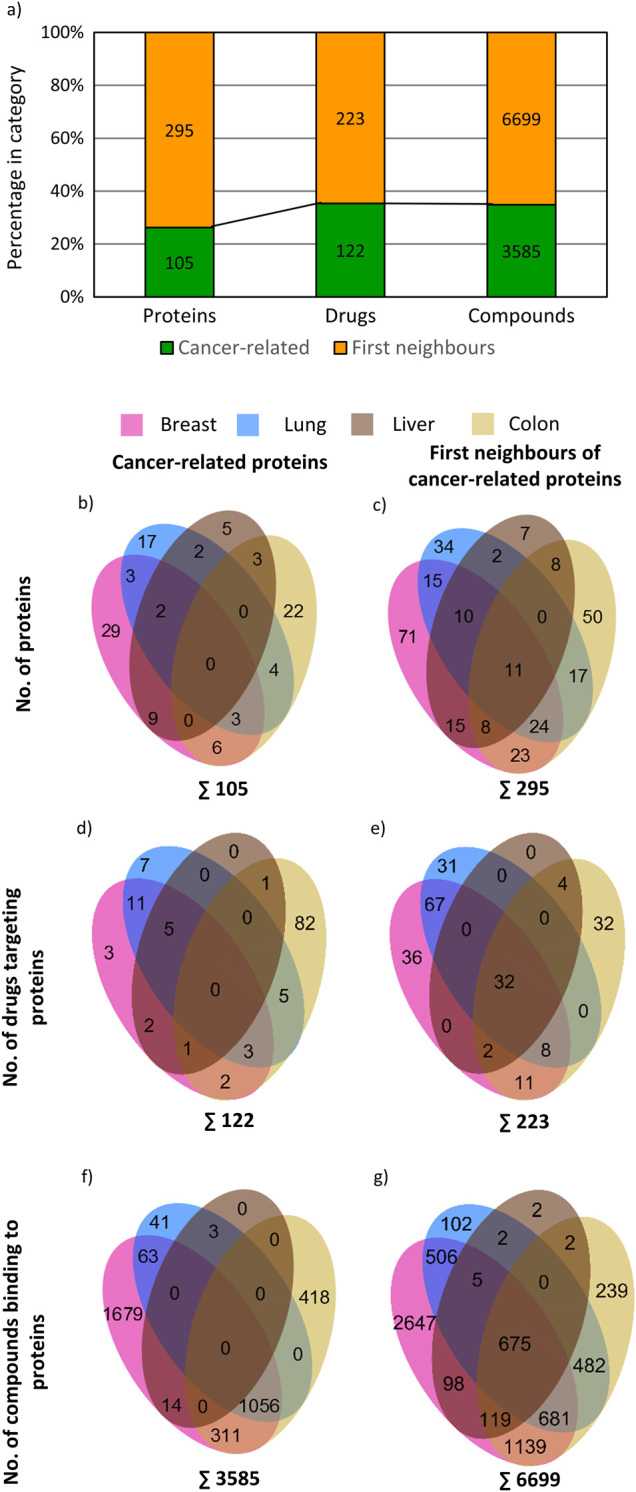
Number of proteins involved in a particular cancer, as well as drugs and compounds acting on cancer-related and their first neighbour proteins. a, Stacked columns show the number of proteins involved in a particular cancer, as well as the number of drugs and compounds acting on cancer-related proteins and their first neighbours, respectively. All stacked columns were compared to the cancer-related/all proteins ratio (Bernoulli test: p < 0.001). Focusing on first neighbours could provide a twofold increase of testable drugs and compounds for anticancer therapy. b–g The venn diagrams show the distribution of available drugs and compounds against the different cancer types. The colours represent each examined cancer type: pink standing for breast, blue for NSCLC, brown for HCC and tan for colon cancer. b The distribution of cancer-related proteins. c, The distribution of first neighbour proteins. d, The distribution of drugs against cancer-related proteins. e, The distribution of drugs against first neighbour proteins. f, The distribution of compounds against cancer-related proteins. g, The distribution of compounds against first neighbour proteins