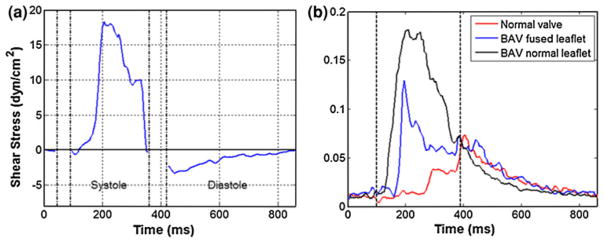
FIGURE 3.
(a) Shear stress variation on AV leaflet surface on aortic side during systole and diastole. (b) Shear stress fluctuations in comparison with normal tricuspid valve and a BAV. Note the higher fluctuations in shear stress values as reflected in the “standard deviation” values for BAV.127

