
Figure 1.
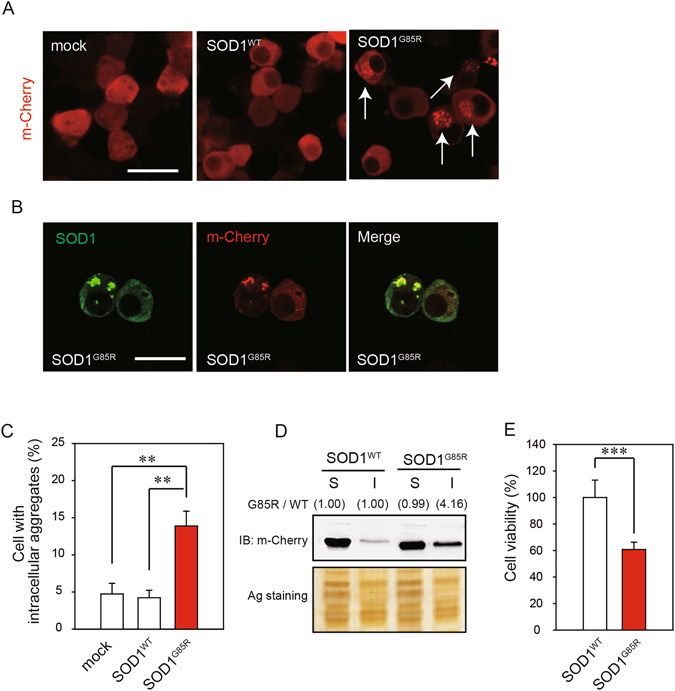
SOD1G85R caused neurotoxicity via the formation of insoluble aggregates. (A) Representative fluorescent microscopy images of N2a cells expressing mCherry-SOD1WT or mCherry-SOD1G85R. The arrowheads indicate the intracellular SOD1 aggregates. (B) Colocalization of SOD1 and mCherry in the N2a cells. (C) Quantified data of intracellular SOD1 aggregates are expressed as mean ± S.E.M from three independent experiments. In each experiment, at least 200 cells were counted. (D) Immunoblot analysis of SOD1 aggregates. N2a cells expressing SOD1 constructs were lysed with 1% TritonX-100 (Triton soluble fraction; S). Triton-insoluble fraction (I) were resuspended with 2% SDS and then analyzed with immunoblotting by anti-mCherry antibody. (E) N2a cells expressing mCherry-SOD1WT or mCherry-SOD1G85R were incubated for 48 h in the differentiation medium. The cell viability was measured by MTT assay. **p < 0.01, ***p < 0.001. Scale bar: 50 µm.