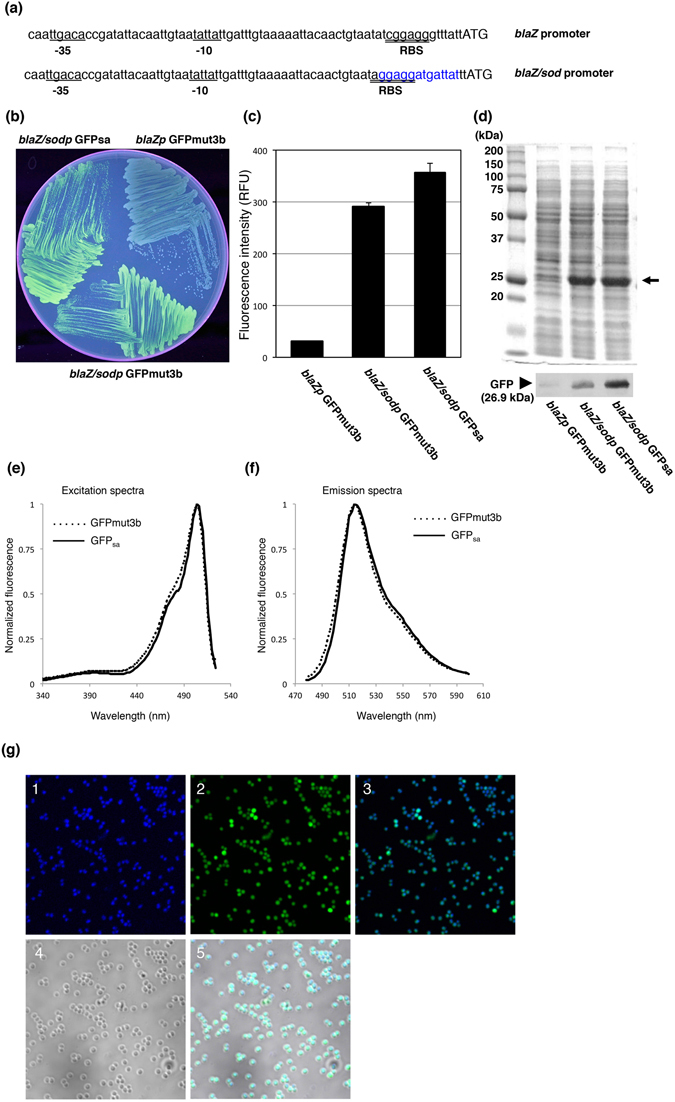
Figure 1.

Replacement of RBS sequence and introduction of Cycle3 mutations into GFPmut3. (a) Sequence alignment of the blaZp and its derivative blaZ/sodp promoters. Blue bold face indicates the surrounding sequence containing RBS derived from the sod gene. Underlined sequences indicate −35 and −10 elements of the blaZ promoter. Double underlines indicate the RBS sequence. Initiation codons are shown in uppercase. (b) The fluorescing colonies were photographed under UV excitation. S. aureus RN4220 containing pS1GFP, pFK51, and pFK52 were grown on TSB agar plate containing chloramphenicol. (c) The fluorescent intensities of GFPmut3b, and GFPsa in S. aureus RN4220. Cell homogenate of S. aureus containing pS1GFP, pFKS1 and pFK52 was prepared and the fluorescent intensities at 513 nm were measured with a microplate reader, λex = 490 nm. The data represent mean values ± standard deviation. (d) The expression efficiency of pS1GFP, pFK51, and pFK52 in S. aureus RN4220. SDS-PAGE and Western blot analysis show the relative quantities of the GFP in the whole cell lysates. The Western blot gel was cropped and the full-length image is included in Supplemental Fig. 5(a). (e) Excitation and (f) Emission spectra for GFPmut3b and GFPsa in S. aureus RN4220. Each spectrum was normalized to a maximum value of 1. Excitation spectra were recorded with emission at 540 nm. Emission spectra were recorded with excitation at 460 nm. GFPmut3b and GFPsa were depicted by a solid line and dotted line, respectively. (g) S. aureus RN4220 containing pMK4blaZ/sodpGFPsa (pFK52) was grown on TSB containing chloramphenicol and visualized using an FV1000 confocal scanning laser microscope (Olympus). Panels show (1) DAPI, (2) GFP, (3) overlay of DAPI and GFP images, (4) differential interference contrast (DIC), (5) overlay of DAPI, GFP, and DIC images.
