Figure 4.

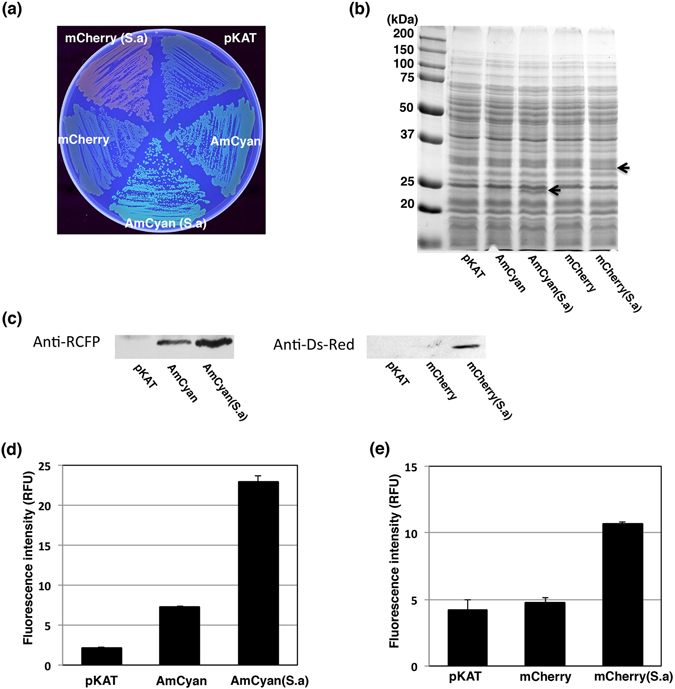
Codon usage optimization of the amCyan and mCherry genes. (a) The fluorescing colonies were photographed under UV excitation. S. aureus strain MW2 containing pKAT (control), pFK62 (AmCyan), pFK64 (AmCyan(S.a)), pFK63 (mCherry), and pFK65 (mCherry(S.a)) were grown on TSB agar plates containing chloramphenicol. (b) SDS-PAGE analysis showed the relative quantities of AmCyan and mCherry in the whole cell lysates. Arrows indicate the position of AmCyan and mCherry in gel. (c) Western blot analysis of AmCyan or mCherry in the whole cell lysates. The Western blot gels were cropped and the full-length image are included in Supplemental Fig. 5(d). The comparison of fluorescent intensities of pKAT (control), pFK62 (AmCyan), and pFK64 (AmCyan(S.a)) in S. aureus MW2. The fluorescent intensities at 489 nm were measured with a microplate reader, λex = 458 nm. The data represent mean values ± standard deviation. (e) The comparison of fluorescent intensities of pKAT (control), pFK63 (mCherry), and pFK65 (mChaerry(S.a)) in S. aureus MW2. The fluorescent intensities at 610 nm were measured with a microplate reader, λex = 586 nm. The data represent mean values ± standard deviation.
