
Figure 2.
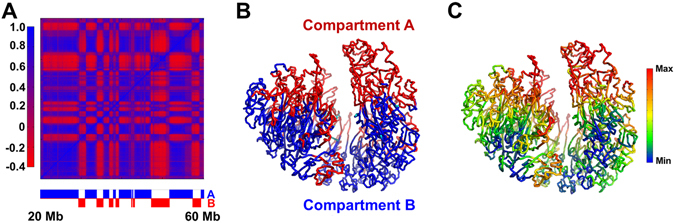
Characterization of A/B compartments. (a) Pearson correlation matrix. The plaid pattern suggests chromatin spatially segregates into two compartments. The assignment of each genomic region into chromatin compartments A/B is shown below. The associated degree of compartmentalization is shown in the left bar. (b) Spatial segregation between chromatin compartments A/B. On the representative modeled conformation, chromatin compartments A and B are shown in red and blue, respectively. (c) Projection of degree of compartmentalization onto representative conformation.