
Figure 3.
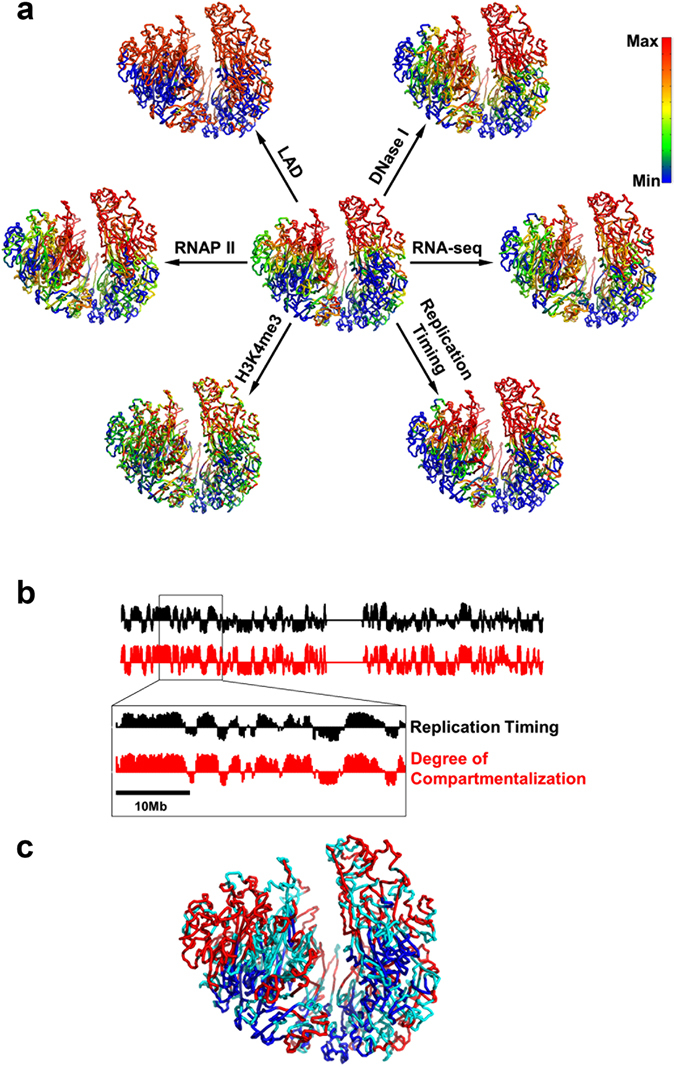
Spatial segregation of genome features. (a) Mapping of genome features onto the 3D chromatin structure. The degree of compartmentalization is shown in the center for comparison. Genomic features are presented as smoothed experimental data over different window sizes: 50-kb for LAD and H3K4me3, 200-kb for replication timing, 400-kb for DNase I, 2-Mb for RNA-seq and RNAP II. The maximum/minimum of color bar stands for the value of average +/−standard deviation. The red color represents deficiency of lamina-associated domain (LAD), enrichment of DNase I hypersensitive sites (DNase I), enrichment of RNA polymerase II (RNAP II), active gene expression (RNA-seq), enrichment of active histone modifications (H3K4me3) and early replication timing (Replication Timing). (b) Comparison between replication timing and degree of compartmentalization along the chromosome. (c) Spatial segregation between PMD (blue color) and non-PMD (red color). Domains with size smaller than 300 kb are not grouped into type A or B (cyan color).