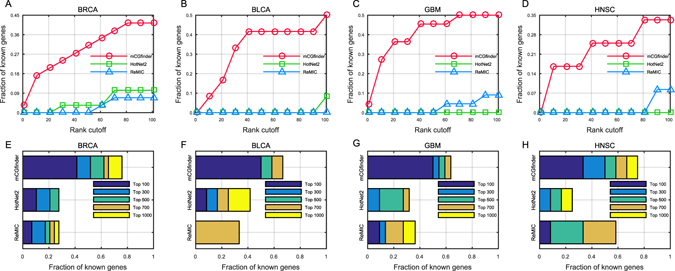
Figure 3.

Rank cutoff curves of top 100 candidates in mCGfinder (red line with circle markers), HotNet2 (green line with square markers) and ReMIC (blue line with triangle markers) results, describing the relation between various cutoffs and the fraction of known CGC cancer genes ranked above this cutoff in BRCA (A), BLCA (B), GBM (C) and HNSC (D). Cumulative fractions of known CGC cancer genes annotated by CGC within the top 100, 300, 500, 700 and 1000 genes in BRCA (E), BLCA (F), GBM (G) and HNSC (H). Results from all the assessments indicate the generally improved performance of mCGfinder over the competing methods.
