
Figure 6.
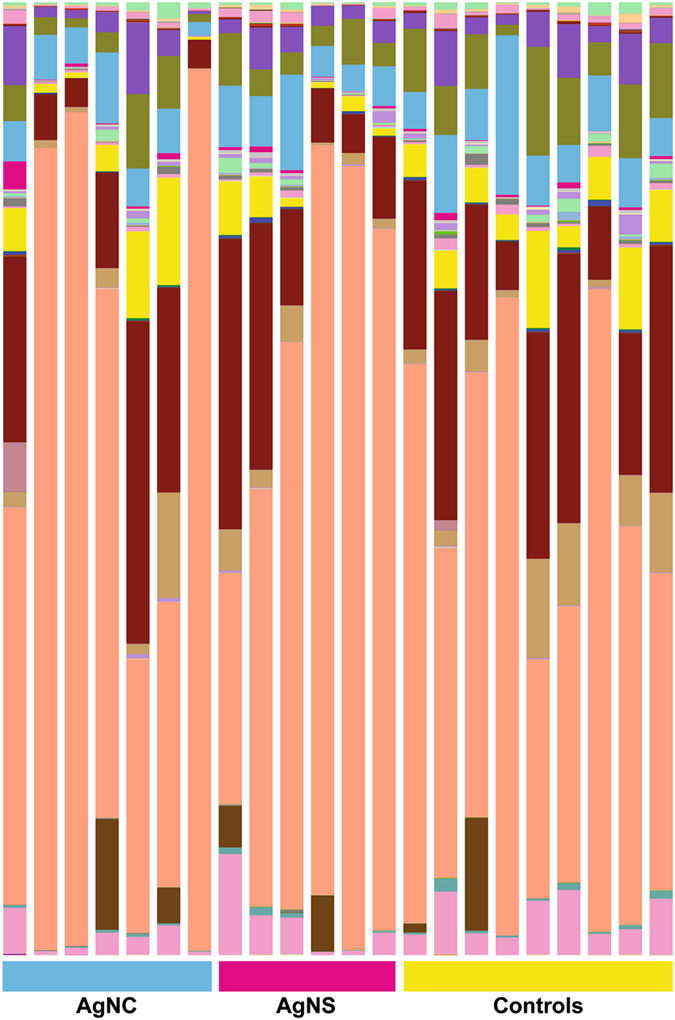
Bar plot of fecal microbiome data from AgNC, AgNS, and control groups. Bar plot analysis of the most abundant bacterial classes in all three-treatment groups.
Official websites use .gov
A
.gov website belongs to an official
government organization in the United States.
Secure .gov websites use HTTPS
A lock (
) or https:// means you've safely
connected to the .gov website. Share sensitive
information only on official, secure websites.
Bar plot of fecal microbiome data from AgNC, AgNS, and control groups. Bar plot analysis of the most abundant bacterial classes in all three-treatment groups.