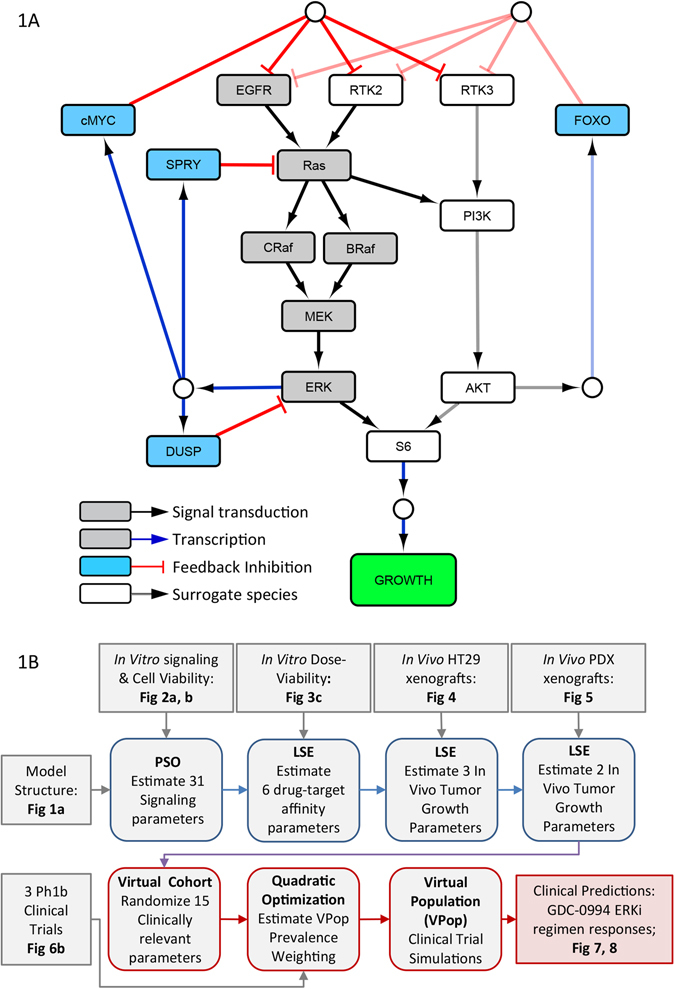
Fig. 1.

MAPK signaling model structure and development workflow. a Model structure. Gray nodes indicate core MAPK signal signaling components, blue nodes represent regulatory feedback components, and white nodes surrogate alternate pathway (PI3K/Akt), alternate receptors (RTK2, 3), and signal integration (S6) components. b Model development workflow, highlighting data inputs (gray boxes), pre-clinical modeling tasks (blue boxes), and clinical translation modeling tasks (red boxes), and associated figures. PSO particle swarm optimization, LSE least squares estimation
