
Fig. 3.
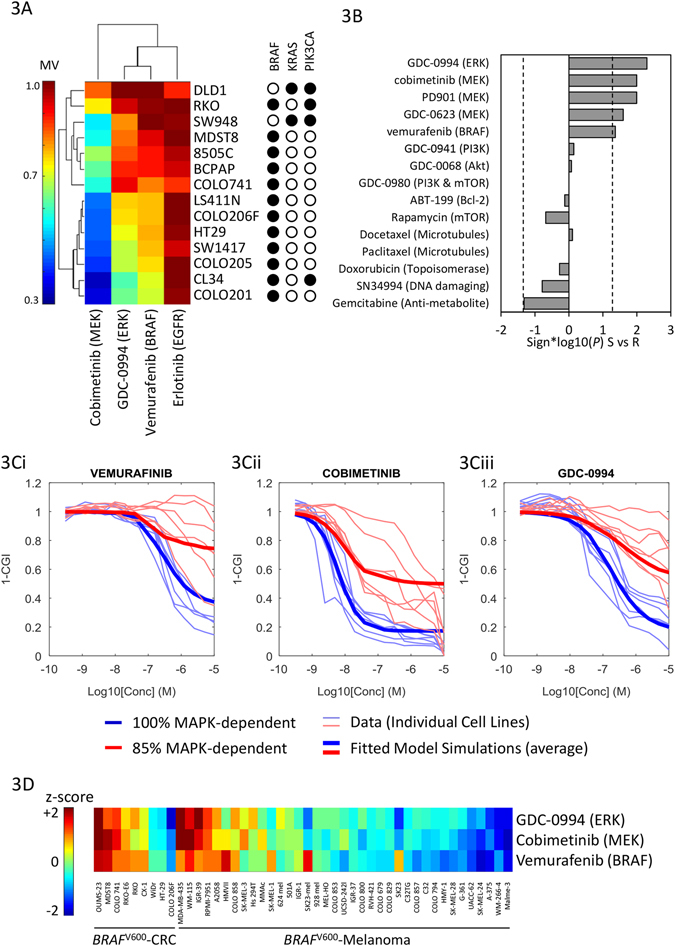
MAPKi sensitivity profiles of CRC cell lines. a Sensitivity (mean viability) of 14 CRC cell lines to EGFR, BRAF, MEK, and ERK inhibition. b Median differences in sensitivity (mean viability) between the seven sensitive (S) vs. seven resistant (R) cell lines to 15 drugs, including five MAPK pathway inhibitors, five inhibitors of other signaling pathways, and five cytotoxic chemotherapies. c Cell viability dose–responses of 14 cell lines to vemurafenib, cobimetinib, and GDC-0994. Cell lines are annotated as relatively MAPKi sensitive (blue) vs. resistant (red), overlying individual cell line data (light lines) and model simulations (thick lines). c Normalized sensitivity (z-scored mean viability) of nine CRC and 37 melanoma cell lines to GDC-0994 cobimetinib and vemurafenib