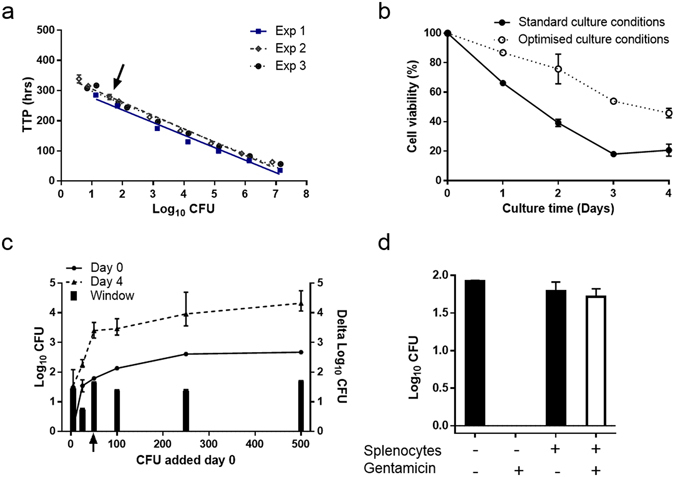
Figure 1.

Assay optimisation and fundamental parameters in the splenocyte MGIA. (a) Results from three independent experiments (Exp 1, 2 and 3) in which serial 10-fold dilutions of M.tb Erdman were added MGIT tubes to produce a standard curve from which the time to positivity (TTP) could be related to inoculum size. Log10 colony forming units (CFU) were determined by plating aliquots of M.tb Erdman on agar plates. Error bars represent mean ± range of measurements done in duplicates. (b) Cell viability of naive splenocytes cultured in standard media with rotation (standard culture conditions) or in enriched media without rotation (optimised culture conditions). Error bars represent mean ± range of duplicates measured of splenocytes pooled from three naive mice. The results are representative of three independent experiments. Similar viability was confirmed by manual nigrosine count. (c) Splenocytes from individual naïve mice were co-cultured in four days with 5, 25, 50, 100, 250 or 500 CFU of M.tb Erdman under optimised culture conditions (Day 4). The inoculums were directly transferred to MGIT tubes at day 0 to generate a baseline (Day 0). Error bars represent mean ± range of measurements done in duplicates (Day 0). Error bars represent mean ± range of one mouse measured in triplicates (25, 50, 250 and 500 CFU) or in four replicates (5 and 100 CFU) (Day 4). The window was calculated by subtracting the mean values at Day 0 from Day 4. (d) Splenocytes from naïve mice were co-cultured for three hours with 50 CFU of M.tb Erdman followed by one hour of 0 or 100 μg/ml gentamicin treatment before they were inoculated in MGIT tubes. In parallel, samples without splenocytes were incubated. Error bars represent mean ± range of duplicates measured of splenocytes pooled from two mice.
