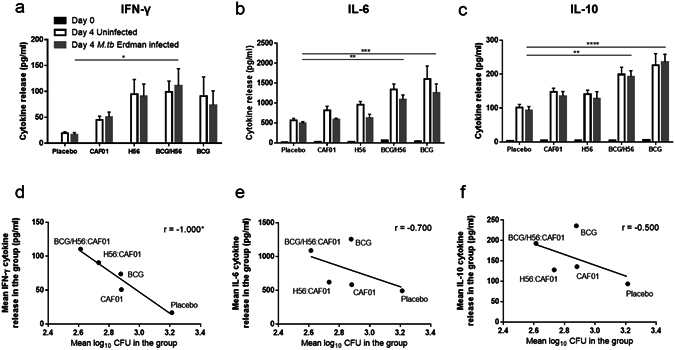
Figure 8.

Cytokine release associated with vaccination but not infection. Groups of mice were immunised three times s.c. with 2-week intervals with H56 in CAF01, H56:CAF01 SBS with BCG or given placebo (Tris buffer) or CAF01 as controls. At the same time, as the first vaccination, a group of mice received a single dose BCG. Splenocytes were isolated one week after the last immunisation and used in the MGIA. Culture supernatants were analysed for the released cytokines IFN-γ (a), IL-6 (b) and IL-10 (c). Black bars indicate the levels of cytokines released from splenocytes before in vitro culture, while grey bars represent the levels of cytokines measured in the MGIA cultures after four days infection and white bars represent cytokines measured in cultures without infection. Bars represent mean + SEM of eight mice (CAF01 n = 10). For the groups of mice where growth inhibition and MSD data was available (n = 5), scatter plots of mean log10 CFU values versus mean levels of IFN-γ (d), IL-6 (e) and IL-10 (f) measured in the same MGIA samples were drawn. One-way ANOVA with Dunnett’s multiple comparisons test was used to compare cytokine levels between vaccinated and placebo control groups (a–c). *p < 0.05; **p < 0.01; ***p < 0.001; ****p < 0.0001. (d–f) Spearman’s rank *p < 0.05.
