
Figure 4.
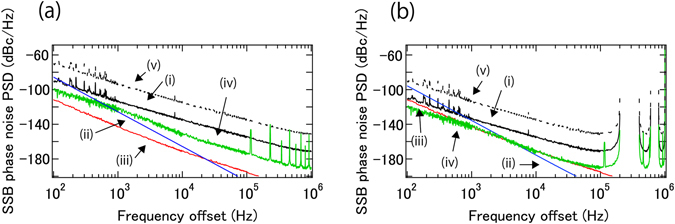
Sensitivity of the phase noise measurement for a 100 m fiber (a) and 1 km fiber delay (b) for +/−10 th harmonics. (i, black), (ii, blue), (iii, red), and (iv, green) curves are sensitivity limits from background noise, fiber noise, cw laser noise, and intensity noise before PDs for the use of +/−10th order sidemodes, respectively. (v, dotted black) curves are sensitivity limits from background noise for the use of +/−1st order sidemodes.