Figure 5.

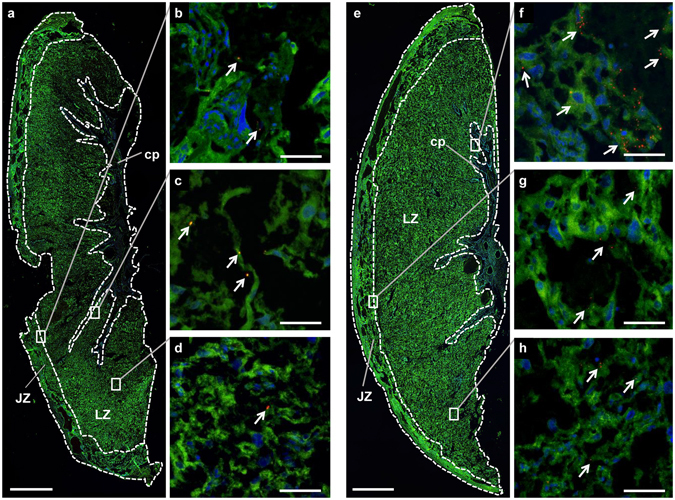
(a–d) PGMA and (e–h) PGMA-PEI nanoparticles in the placenta at ED20. (a) Representative tissue section of a placenta from a PGMA treated dam with key tissue regions indicated (n = 4 per group). (b–d) Higher magnification images of the areas indicated by the rectangles in (a). PGMA nanoparticles (indicated by arrowheads) were observed in the (b) chorionic plate, in the tissue adjacent to the (c) junctional zone and in the (d) labyrinth zone. (e) Representative tissue section of a placenta from a PGMA-PEI treated dam with key tissue regions indicated (n = 4 per group). (f–h) Higher magnification images of the areas indicated by the rectangles in (e). PGMA-PEI nanoparticles (indicated by arrowheads) were observed in the (f) chorionic plate, in the tissue adjacent to the (g) junctional zone and in the (h) labyrinth zone. Scale bars: (a,e) 1000 µm; (b–d,f–h) 200 µm. JZ: junctional zone; LZ: labyrinth zone; cp: chorionic plate.
