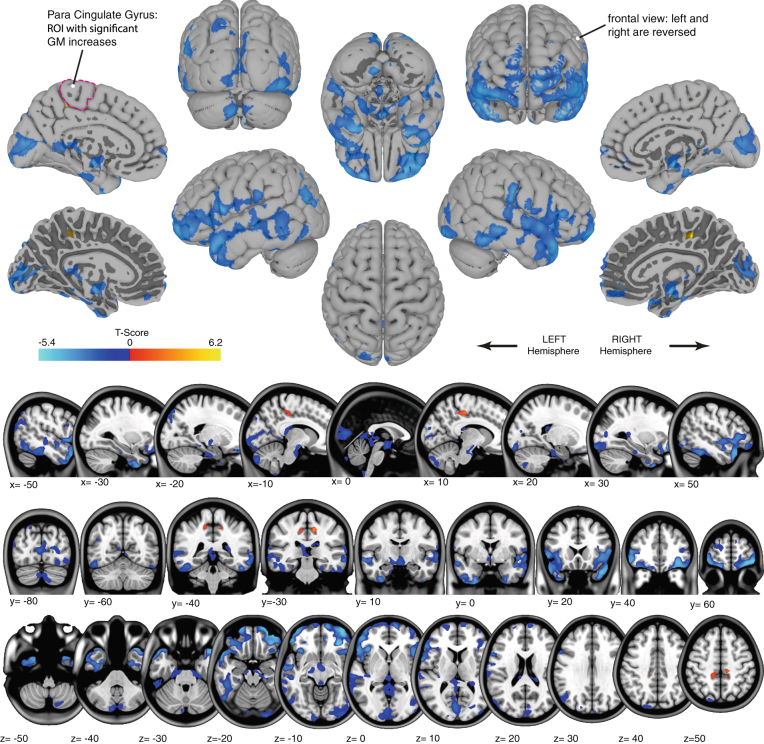
Fig. 1.
Gray matter changes as a function of spaceflight. Red-to-yellow gradients show regions with significant gray matter volume increase. Blue gradients show regions with significant gray matter decreases. Results are displayed on top of the pial surface of the ICBM MNI brain (surface view; top) or overlaid on the ICBM MNI T1 image (bottom). For the medial surface views, additional surface images that show the border of the white and gray matter are provided (marked with “*”) to show the gray matter changes that are present in deeper sulcal regions. The right side of the image corresponds with the right side of the brain, unless mentioned otherwise. The para cingulate gyrus that shows significant overall gray matter increases from pre- to post-flight is outlined on one of the surface images

