Figure 7.

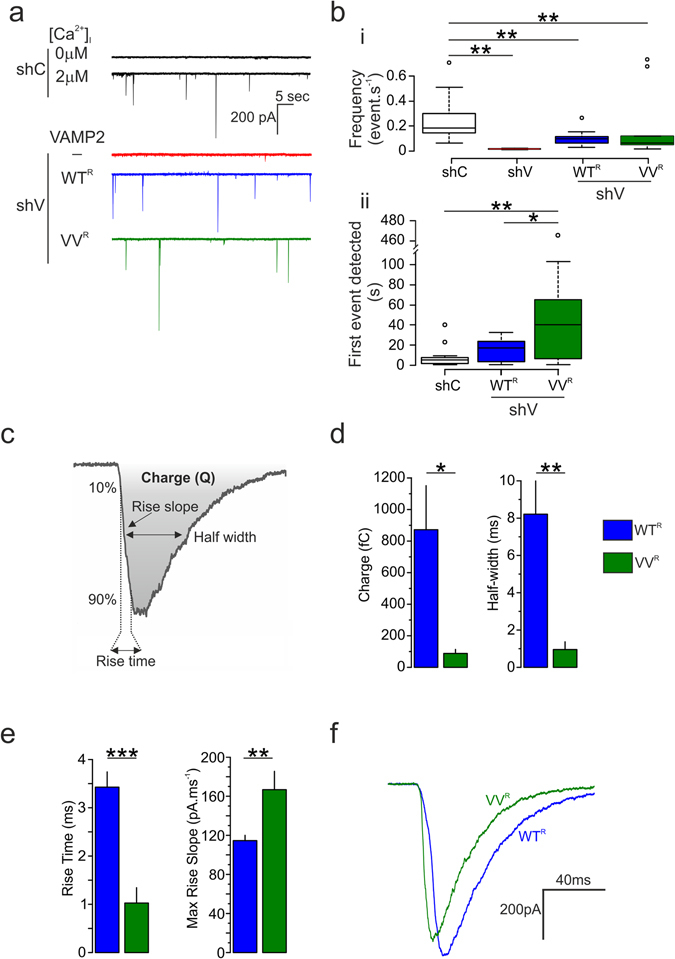
VAMP2 G100/C103 influence fusion pore opening. Measurements of quantal release of ATP via P2X2 receptor mediated currents from INS-1 832/13 cells expressing VAMP2 WT (G100/C103) or VV (G100V/C103V) after knock-down of endogenous VAMP2. (a) Currents triggered by ATP release. Top traces show INS-1 832/13 cells transfected with shC (black trace) and infused with media containing 0 or 2 μM free calcium. The 3 bottom traces are from cells co-transfected with plasmid P2X2-YFP, shC or shV, and VAMP2-pHL (WTR or VVR), respectively (black, shC; red, shV + empty vector; blue, shV + VAMP2pHL WTR; green; shV + VAMP2pHL VVR). (b i) Frequency of events per second (ANOVA and Tukey shC vs. shV p = 0.004, vs WTR p = 0.004, vs. VVR p = 0.001; shC, 12 cells, n = 802 events total; shV, 6 cells, n = 30 events total; WTR 12 cells, n = 388 events; VVR, 8 cells, n = 695 events; °, outliers). (b) Response delay defined as time required for the first event to be detected (ANOVA and Tukey, shC = 4 ± 0.86 s, WTR = 14, 43 ± 3.21 s, VVR = 36.90 ± 11.48 s. (c) Schematic illustration of the charge, the 10% to 90% rise time, the rise slope, and the half width of the current generated by P2X2R. These parameters are measured for the fusion pore kinetics study. (d,e) Mean values of the medians for the charge, the half width (d) and rise time and its slope (e), respectively (*p < 0.05, **p < 0.01, t test). (f) Superimposition of currents of similar amplitude elicited from cells expressing VAMP2pHL WTR (blue) and VVR (green).
