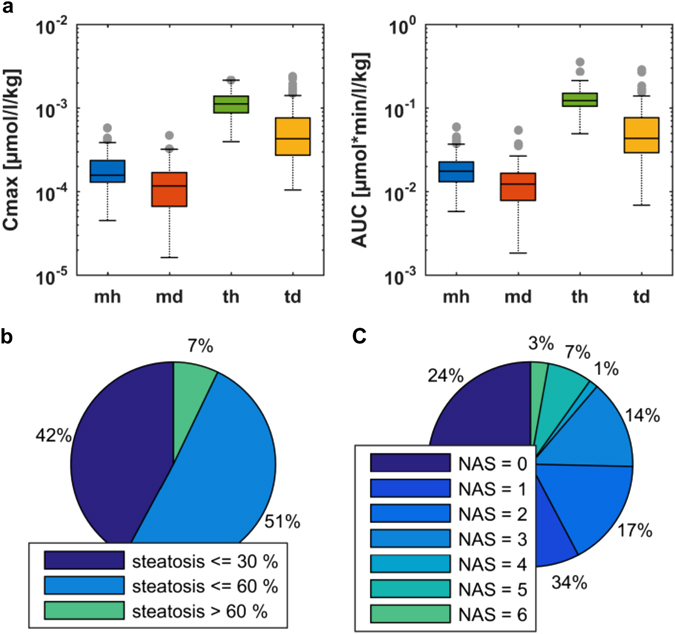
Fig. 2.

Evaluation of experimental PK data and individual metadata for midazolam and torsemide in healthy individuals and diseased patients. a Boxplots of Cmax and AUC for healthy individuals and diseased patients treated with midazolam or torsemide. b Fractions of individuals with different levels of steatosis. c Fractions of individuals with different NAS. Blue indicates midazolam data from healthy population (mh); green torsemide data from healthy population (th); red midazolam data from diseased population (md); yellow torsemide data from diseased population (td)
