
Fig. 3.
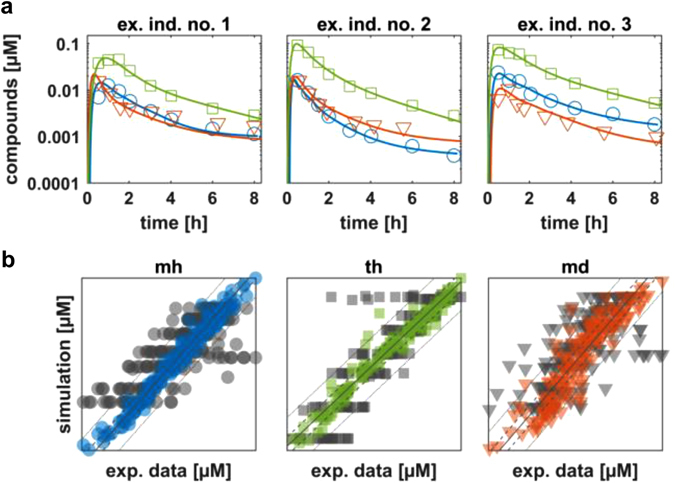
Individual model simulations after application of the three learning steps of the translational approach. a Simulations of venous blood plasma concentration based on parameters with maximum posterior probability are shown for three example individuals. b Comparison of experimental data of venous blood plasma concentration with simulations of the mean value model (start parameterization) at experimental time points (gray), and experimental data from simulations with individual-specific parameterized models (based on acquired distributions) at experimental time points (colored). Blue circles indicate midazolam data from healthy population (mh); green squares indicate torsemide data from healthy population (th); red triangles indicate midazolam data from diseased population (md)