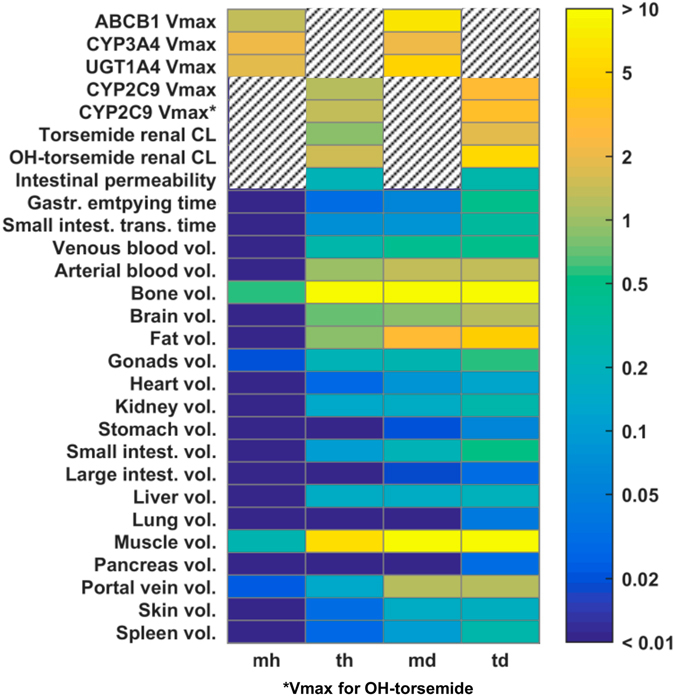
Fig. 5.

Learning progression. Heat map shows Kullback–Leibler divergence (relative entropy) between acquired knowledge and initial knowledge for each learning step. Color code represents learning progression from blue (learned nothing) to yellow (learned very much). Hatching indicates that parameters have not been considered in the respective model such that relative entropy could not be determined
