Fig. 5.
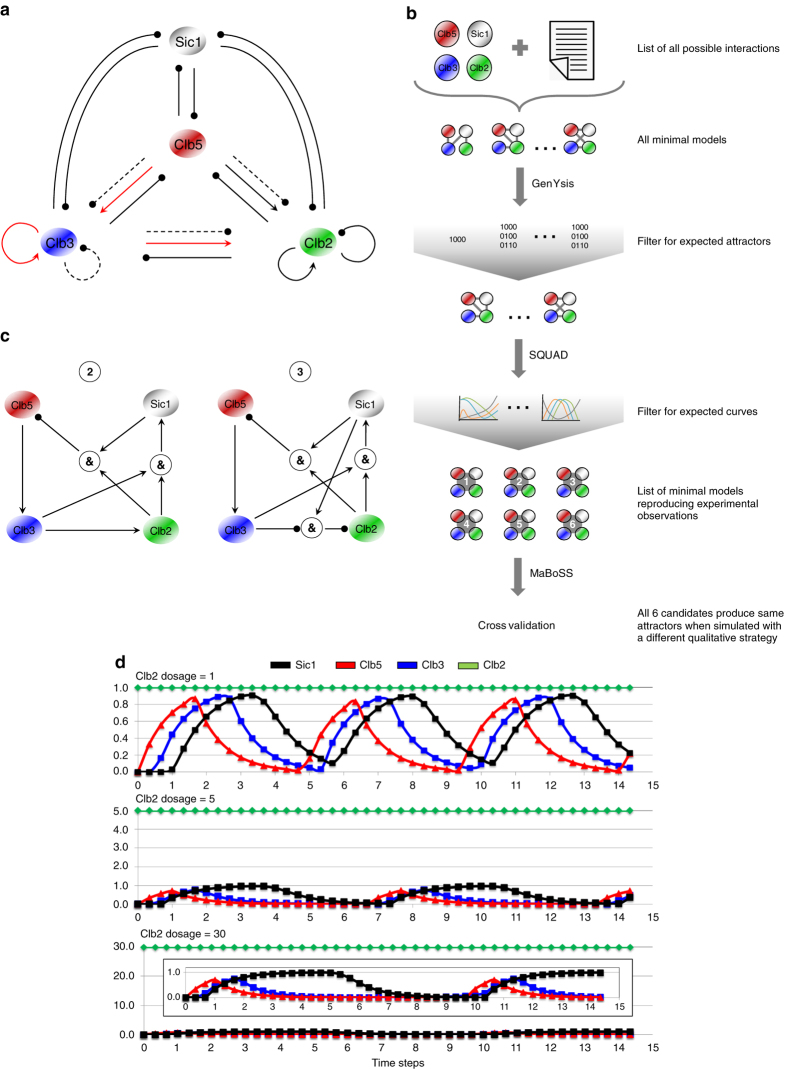
Expected oscillations in the Clb cyclin network and definition of Boolean attractor candidates. a Minimal prior knowledge network (PKN) encompassing the interactions among Clb5 (red), Clb3 (blue), Clb2 (green), and their inhibitor Sic1 (black). Known interactions are indicated with solid lines.12 For the newly unraveled interactions, both potential activatory and inhibitory regulations are considered: interactions mimicking positive regulations of an early Clb/Cdk1 complex on the next one through the Fkh2 transcription factor are indicated with solid red lines; interactions mimicking negative regulations of an early Clb/Cdk1 complex on the next one through the Fkh2 transcription factor are indicated with dashed black lines. b Boolean modeling strategy. Novel and known interactions occurring among Clbs and Sic1 were implemented in the models, which were then filtered for the expected attractors (by using GenYsis) and for the expected curves (by using SQUAD). The collection of minimal models reproducing the experimental observations was then validated by using a different qualitative strategy (MaBoSS). c Minimal candidate models reproducing experimental Clb and Sic1 waves and satisfying CLB2 overexpression experiments.27 The minimal models 2 and 3 satisfy the known experimental conditions (wild type, SIC1 overexpression and sic1Δ) by both Boolean simulations (GenYsis) and standarized ODE simulations (SQUAD). Arrows and circles denote activations and inhibitions, respectively. d SQUAD simulations of CLB2 overexpression experiments for the minimal model 2. From top to bottom are plotted simulations of an increase dosage of Clb2: 1 (upper panel), 5 (mid panel), and 30 (bottom panel). The insert in the bottom panel represents a magnification of Sic1, Clb5, and Clb3 oscillations when Clb2 is set to 30. It shall be noted that by the computational time t = 15 the cycles are progressively reduced when increasing the Clb2 level. The results are in agreement with the experimental observations.27

