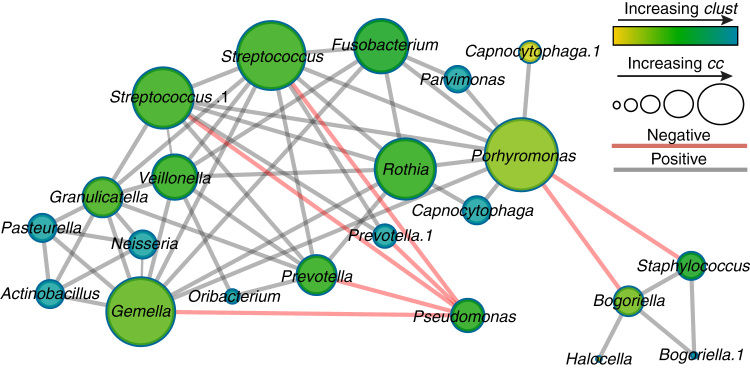
Fig. 1.
Co-occurrence network inferred from the SparCC algorithm applied to 16S rRNA gene data of 126 CF sputum samples. Co-occurrence and anti-occurrence of taxa is denoted with grey lines and red lines, respectively. Nodes are sized by their degree closeness centrality (cc) and colored by increasing clustering coefficient (increasing from olive to green to blue). The major taxa clustering strongly support the CAM hypothesis, stating that the CF community splits into two differently pathogenic subgroups: Attack Community members such as Streptococcus, Veillonella and Porphyromonas, and the Climax Community dominated by Pseudomonas and Staphylococcus

