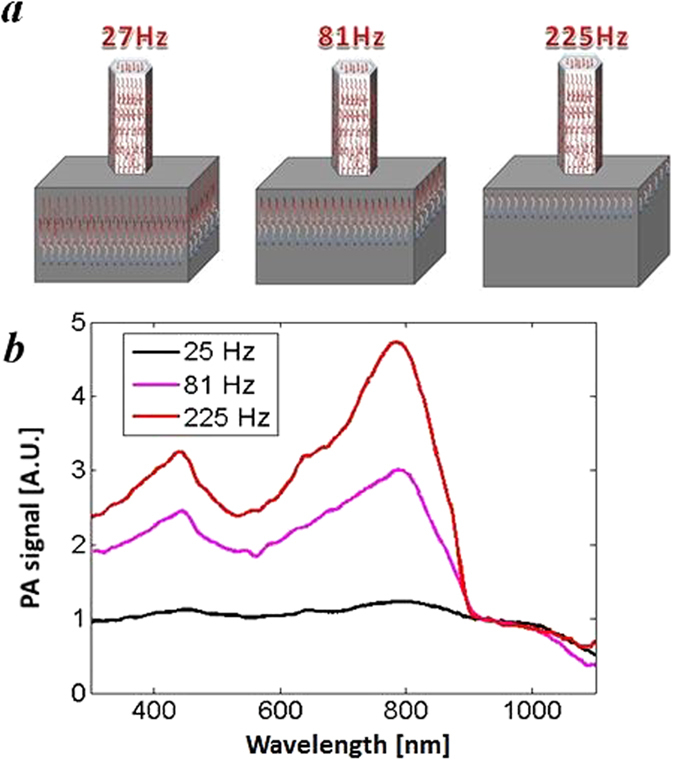
Figure 5.

(a) Schematic of a different surface / NW contributions for different frequencies: at the lowest 27 Hz the PA signal mainly originates from Si substrate, while at the highest 225 Hz it mainly originates from NW absorption. (b) PA spectra for three different frequencies that correspond to the different contribution of the sample surface for sample B. At the highest frequency 225 Hz we observe the resonant peak corresponding to the excitation of HE11 mode.
