Figure 1.

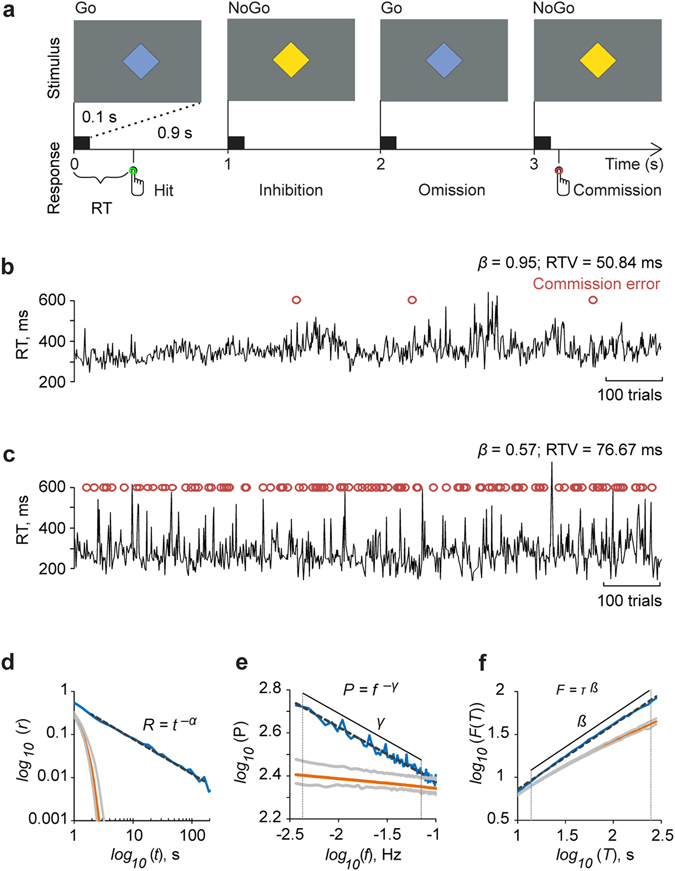
Scale-free dynamics characterizes response time (RT) fluctuations in the Go/NoGo task. (a) A schematics of the Go/NoGo task in which the blue diamond (1°) was the Go (75%) and the yellow (25%) the NoGo stimulus. The stimuli were presented for 100 ms followed by a fixed 900 ms inter-stimulus interval (ISI) during which a grey diamond was shown (not displayed here). Participants were instructed to respond to each Go stimuli and refrain from responding to the NoGo stimuli. Different responses are shown below the timeline. Responses to the Go stimuli were Hits and responses to NoGo stimuli commission errors. (b) The RT time-series collected from a good performer, i.e., one with few commission errors. This subject exhibited a large LRTC scaling exponent (β) that indicates strong power-law autocorrelations in the RT time series. (c) RT time-series of a poor performer, i.e., one with many commission errors. Here a low LRTC exponent value (β) indicates that temporal correlations in the RT time series are close to the ‘no-correlations’ level expected for white noise (β = 0.5). (d) The autocorrelation function (ACF) averaged across the participants (n = 27) and Go stimulus colors in double logarithmic coordinates shows a linear and thus power-law decay of the correlation coefficient (r) as a function of time lag (t) with the power-law scaling exponent α = 0.63 of the grand-average ACF. (e) The grand-average power spectral density (PSD) function shows a power-law decay of power with frequency with scaling exponent γ = 0.25. Vertical lines mark the frequency range 0.004–0.063 Hz used in the estimation of scaling exponent. (f) Grand-average detrended fluctuation analysis (DFA) wherein the fluctuation measure, F(τ), exhibits a power-law relationship with the window size, τ, in the τ range from 15 to 250 s and with the scaling exponent, β = 0.73. In panels e,-f, the corresponding analyses of surrogate data (see Methods) are plotted in orange with the grey lines indicating 99% confidence limits. The hand symbols in Fig. 1a are copyright free. The authors acknowledge IIT Bombay for the design.
