Fig. 5.
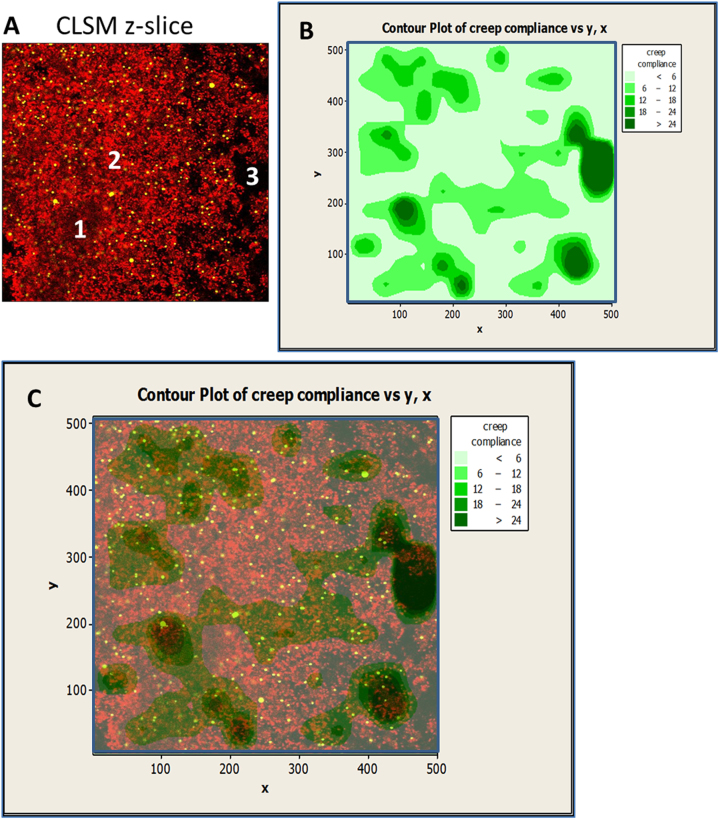
Region-specific Creep compliance analysis. a Example of a horizontal plane (xy-) micrograph of a biofilm layer depicting mCherry-expressing P. fluoresence cells (red) and 1 μm fluorescent beads (green). Zones 1, 2 identify biofilm areas of high low cell density and high cell density respectively. Zone 3 is recognized as surrounding bulk suspension. b Bead trajectories from zones 1 and 2 are used to calculate MSDs used to determine Creep compliance. Akima's polynomial method for the interpolation of creep compliance values for each fluorescent bead’s xy-coordinate was used to generate contour maps. c By merging xy-micrographs and corresponding contour maps, region-specific creep compliance analysis is possible

