Fig. 1.

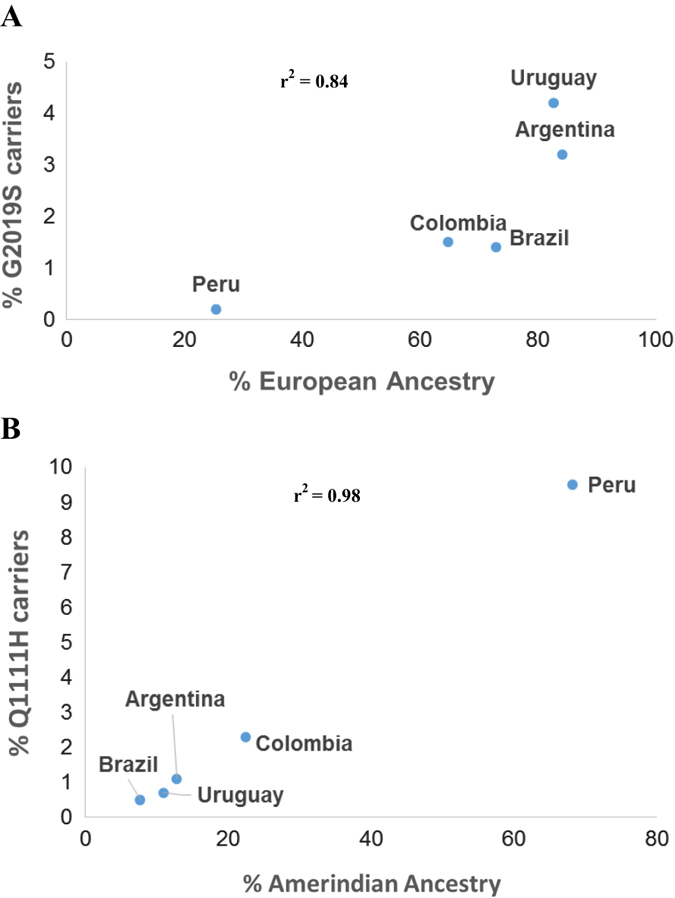
Correlation between frequency of a p.G2019S and b p.Q1111H carriers and the proportion of European or Amerindian admixture in the cohort from each site. Correlation is shown in each of the figures as the coefficient of determination (r2)

Correlation between frequency of a p.G2019S and b p.Q1111H carriers and the proportion of European or Amerindian admixture in the cohort from each site. Correlation is shown in each of the figures as the coefficient of determination (r2)