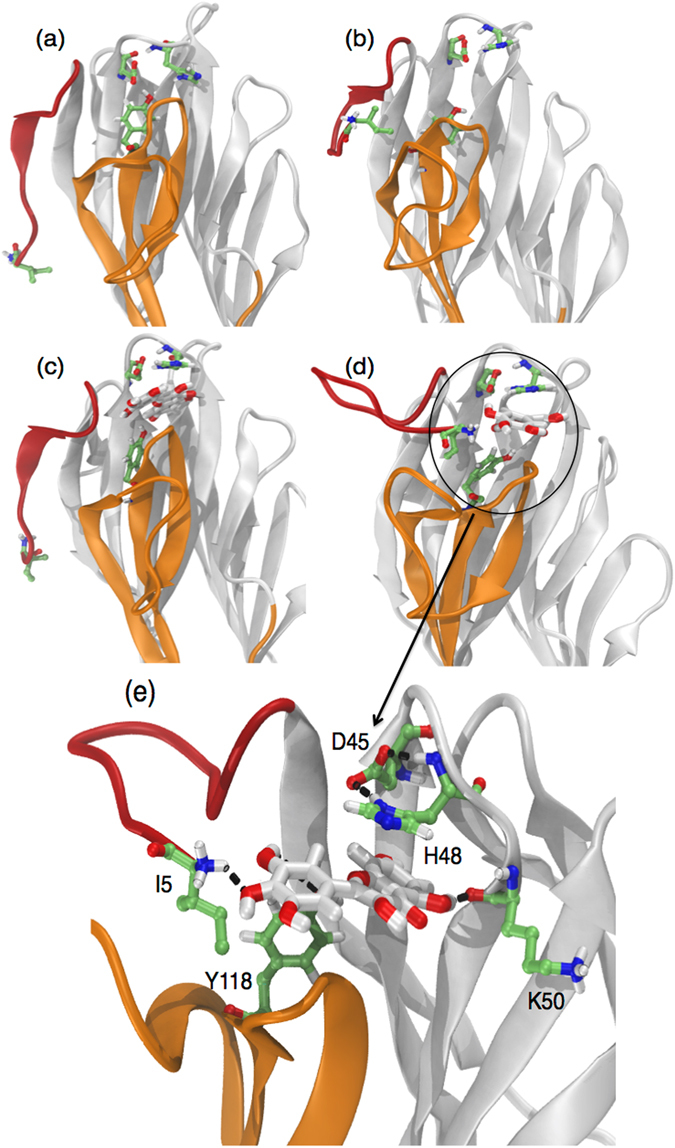
Figure 6.

Computational studies of the structural model for the complex Myr-α-hemolysin (Hla). Initial and final conformations of free (a,b) and Myr-bound (c,d) Hla obtained from MD simulations in explicit solvent and molecular docking calculations. (e) Detailed view of chemical groups and residues involved in the binding of Myr to Hla. The amino latch is colored in red, and the prestem in orange. Receptor residues are shown in green sticks and Myr in white sticks. Hydrogen bonds are represented by black dashed lines. Methodology can be found in Supplementary Methods.
