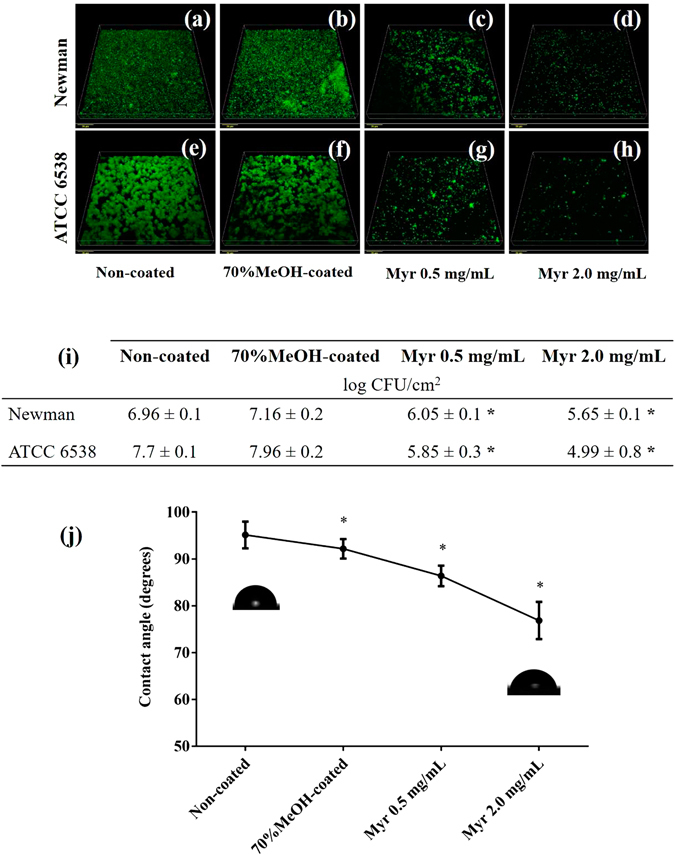
Figure 7.

Effects of Myr when coated on a material surface. (a–d) Confocal images of S. aureus Newman biofilm formation on control surfaces and surfaces coated with Myr. (e–h) Confocal images of S. aureus ATCC 6538 biofilm formation on control surfaces and surfaces coated with Myr. Bars indicate 20 μm. (i) Quantitative data of adhered cells on the surfaces. (j) Water contact angle of material surfaces. *Represents statistically significant difference (p-value < 0.01) from the non-coated material. All of these methodologies can be found in Supplementary Methods.
