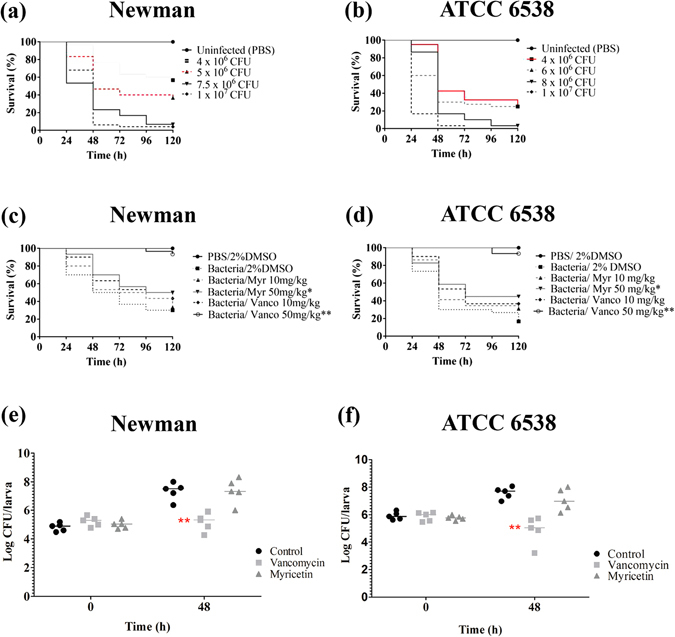
Figure 8.

Kaplan-Meier survival-curve of infected G. mellonella larva and bacterial burden during infection. (a) Survival of G. mellonella larvae infected with different concentrations of S. aureus Newman. (b) Survival of G. mellonella larvae infected with different concentrations of S. aureus ATCC 6538. The inoculum selected for further experiments are presented in red. (c,d) Survival of G. mellonella larvae infected with S. aureus Newman and ATCC 6538, respectively, and treated with two different doses of Myr or vancomycin 30 min post-infection. (e,f) S. aureus Newman and ATCC 6538 larval burden after infection and treatment followed by 0 and 48 h of incubation. Horizontal bars represents the median value of larval burden per group. * And ** represent statistically significant differences, with p-value < 0.05 and p-value < 0.01, from to the larvae group that was infected and received only PBS.
