
Figure 1.
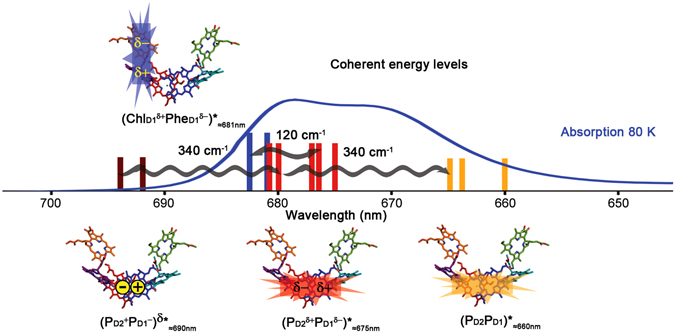
PSII RC X-ray structure, electronic states involved in charge separation and absorption spectrum at 80 K. The energy of the electronic states capable of initiating charge separation are shown as vertical lines on the absorption spectrum at 80 K (blue line) (the different lines for each state correspond to a different realization of the disorder). Only the coherences discussed in the text are shown for clarity. The cofactor participation in each electronic state and its electronic distribution is shown on top of the X-ray crystal structure of the PSII RC (cofactor arrangement adapted from ref. 3): stars and rectangles represent exciton and CT character, respectively. Color code: (PD2PD1 ≈660nm (orange), (PD2 δ+PD1 δ− ≈675nm (red), (PD2 +PD1 −)δ ≈690nm (dark red) and (ChlD1 δ+PheD1 δ− ≈681nm (blue). Cofactors colour code: PD1 (red), PD2 (blue), ChlD1 (purple), ChlD2 (cyan), PheD1 (orange), PheD2 (green). The horizontal wiggled arrows represent the discussed coherences between electronic states observed as cross-peaks in the 120 and 340 cm−1 time-resolved 2D frequency maps. This figure has been adapted from ref. 12.