Fig. 4.
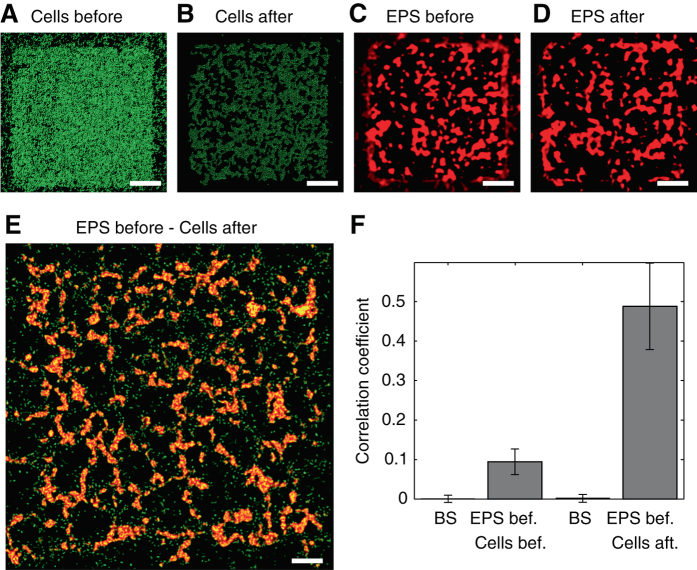
The hole pattern correlates with the EPS distribution. a, b Distribution of fluorescently labeled P. aeruginosa after 8 h of biofilm growth, before (a) and after (b) the passage of an air bubble. c, d Distribution of EPS, fluorescently labeled using lectins (Methods), at the same times and position as a, b. Scale bars, 100 µm. e Overlay of the EPS distribution before the passage of the bubble (red) and the bacteria distribution after the passage of the bubble (green). Data are from a different experiment than a–d. Scale bar, 50 µm. f Normalized cross-correlation between the EPS distribution before the passage of the bubble and the cell distribution before (second bar from left) and after (fourth bar from left) the passage of the bubble. Error bars correspond to the standard error of the mean over three replicate experiments. The first and third bars represent results from a bootstrapping analysis (BS), where the EPS distribution before the air bubble is correlated with random permutations of the cell distribution before (first bar) and after (third bar) the passage of the bubble. Note the lack of correlation in these controls

