
Fig. 2.
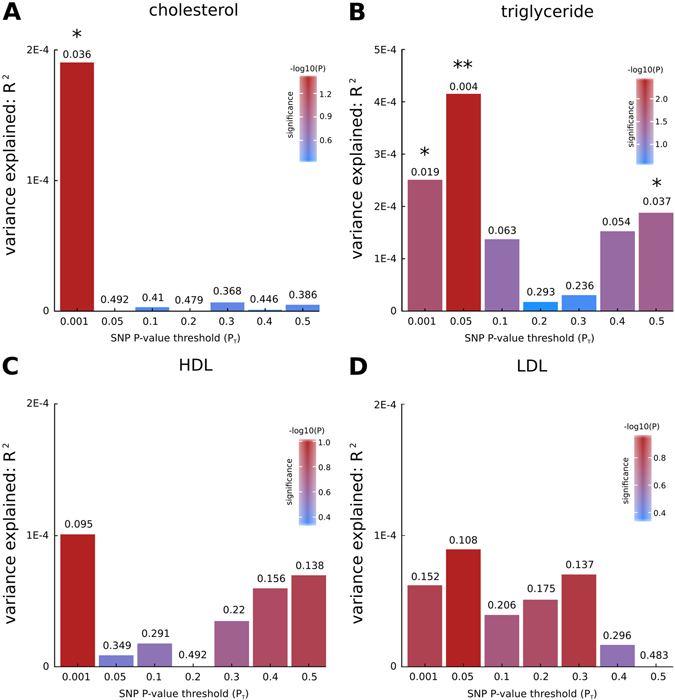
Bar plots from PRSice for shared genetic etiology between four lipid and lipoprotein traits (cholesterol, triglyceride, HDL, and LDL levels) and PD showing results at broad p-value thresholds (p T). The numbers above the bars indicate the p-values for shared genetic etiology, and these p-values were corrected using the false discovery rate (FDR) method; *denotes FDR-corrected p < 0.05, **denotes FDR-corrected p < 0.01