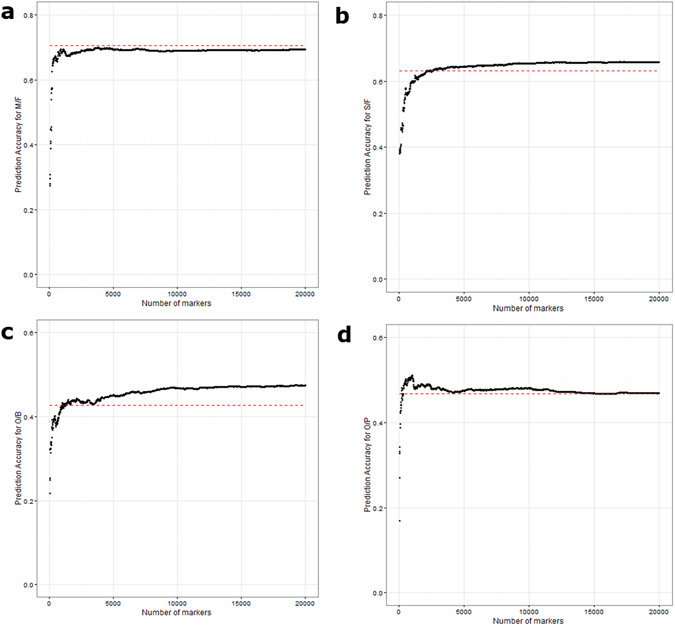
Figure 4.

Average prediction accuracy for 4 traits across different marker densities using RRBLUP-B method: (a) M/F, (b) S/F, (c) O/B and (d) O/P. (a) RRBLUP-B result for M/F with accuracy 0.7 at 3,800 markers (RRBLUP 0.71), (b) for S/F with accuracy 0.66 at 10,530 markers (RRBLUP 0.63), (c) for O/B with accuracy 0.48 at 12,500 markers (RRBLUP 0.43) and (d) for O/P with accuracy 0.51 at 990 markers (RRBLUP 0.47). The red dotted line represents accuracy acquired from RR-BLUP for each trait.
