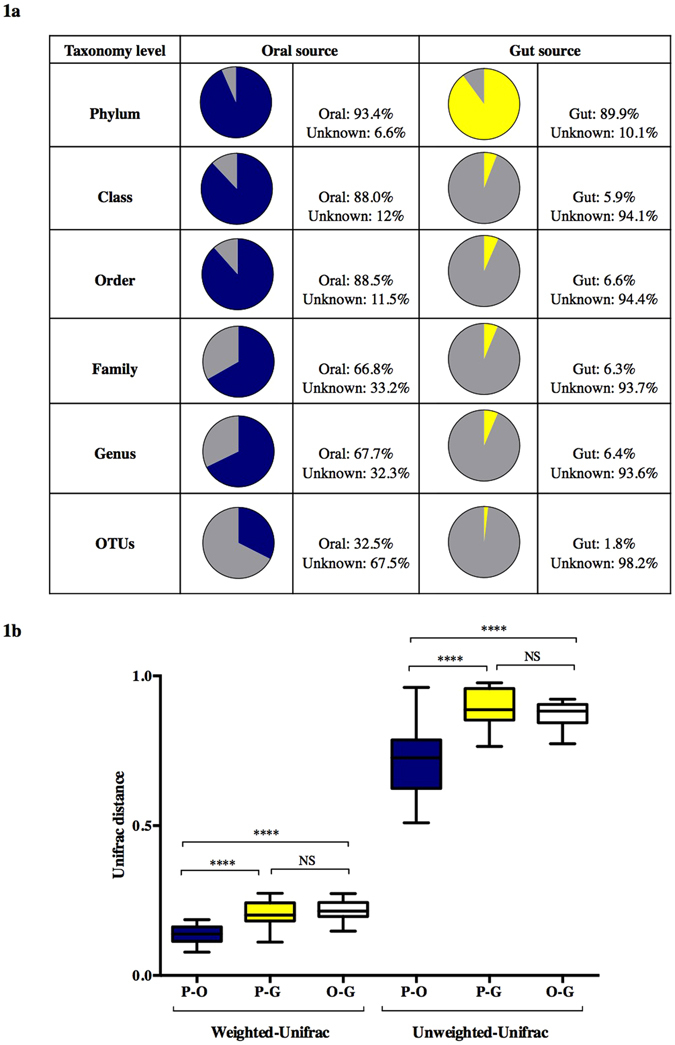
Figure 1.

Maternal oral and gut microbial influences on the placental microbiome (a). Bayesian source-tracking results for placental samples at different taxonomic levels. Proportions of the maternal oral (blue), gut (yellow) and unknown source of environment (grey) on the placental microbiome. Placental samples showed a greater degree of similarity with the maternal oral microbiome. (b) Boxplots showing distances from unweighted and weighted Unifrac distances between the maternal oral (blue) and gut (yellow) with respect to the placental microbiome and between the oral and gut (white) microbiomes (permutations = 999). Each boxplot shows the median, lower and upper quartiles of the Unifrac distances. A lower Unifrac distance shows a greater resemblance between the two microbial communities. Pair-wise comparison were done by Mann-Whitney U tests and annotated as ****p < 0.0001 and NS: not significant.
