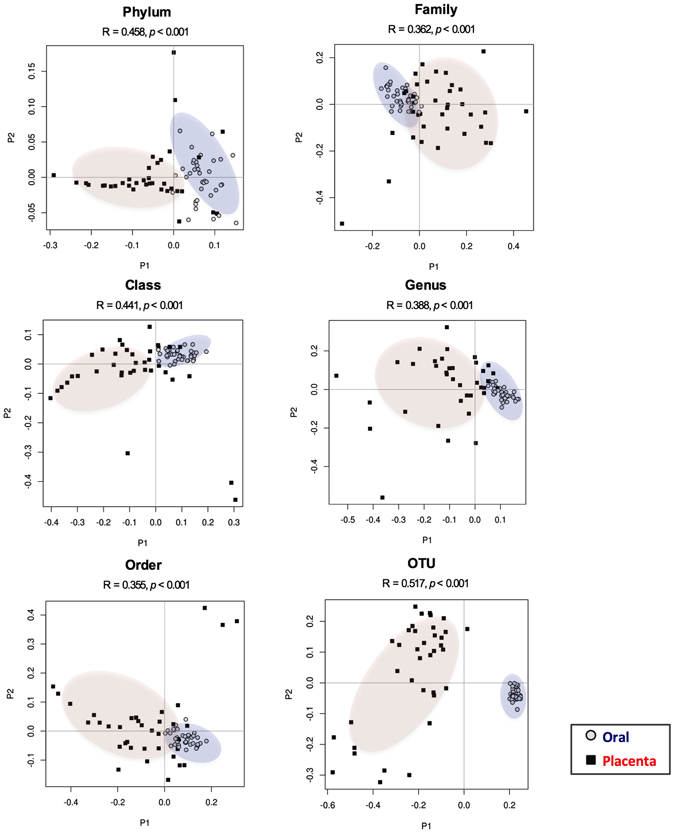
Figure 2.

Differences in microbiome composition among the placental and maternal oral populations. PCoA plots for placental (red) and maternal oral (blue) microbiome at different taxonomic levels. Differences in microbial composition between the placenta and oral samples were determined by Anosim statistic test. An R value close to 1.0 indicates total dissimilarity between the two groups. Significant differences between the placental and oral microbiome were reported at all taxa levels (p < 0.001).
