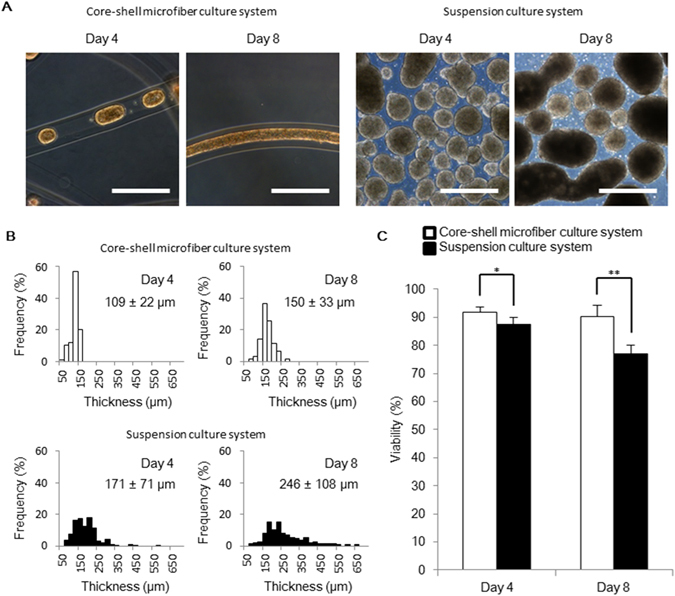
Figure 2.

The thickness and the viability of human iPS cell aggregations in the core-shell microfiber culture system. (A) Microscopic images showing the morphologies of human iPS cell aggregations in the core-shell microfiber culture and the suspension culture systems on day 4 and 8. Scale bar: 500 μm. (B) Thickness distributions of cell aggregations in the core-shell microfiber culture and the suspension culture systems on days 4 and 8. The thickness was calculated by measuring the minor axis of cell aggregation regarded as an ellipse. (C) The cell viabilities in the core-shell microfiber culture and the suspension culture systems after the retrieval of cell aggregations from the microfibers and dissociation of cell aggregations into single cells on days 4 and 8 (N ≥ 3). *P < 0.05.
