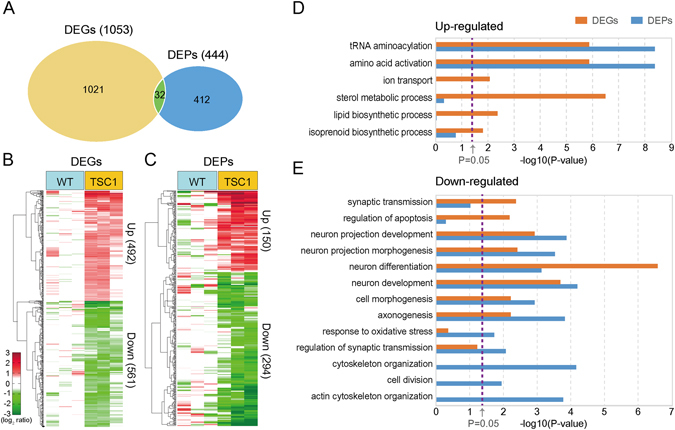
Figure 2.

Genes and proteins altered by hyperactivated mTOR signaling. (A) Relationships between DEGs and DEPs by hyperactivated mTOR signaling. Numbers in parentheses denote the numbers of DEGs and DEPs. (B,C) Heat maps showing up- (Up, red) and down-regulation (Down, green) of DEGs (B) and DEPs (C) between WT (1st to 3rd columns) and TSC1 CKO (4th to 6th columns) samples. The color bar represents gradients of log2-fold-changes between TSC1 CKO and WT. Numbers in parentheses denote the numbers of up- and down-regulated genes or proteins. (D,E) GOBPs represented by up- (D) and down-regulated (E) genes (orange) or proteins (blue). The significance of GOBPs enriched by DEGs or DEPs was displayed by –log10(P) where P is the enrichment P-value obtained from DAVID software. The color bar denotes gradients of –log10(P). The cutoff of P-value (P = 0.05) was indicated by the dotted line.
