
Figure 6.
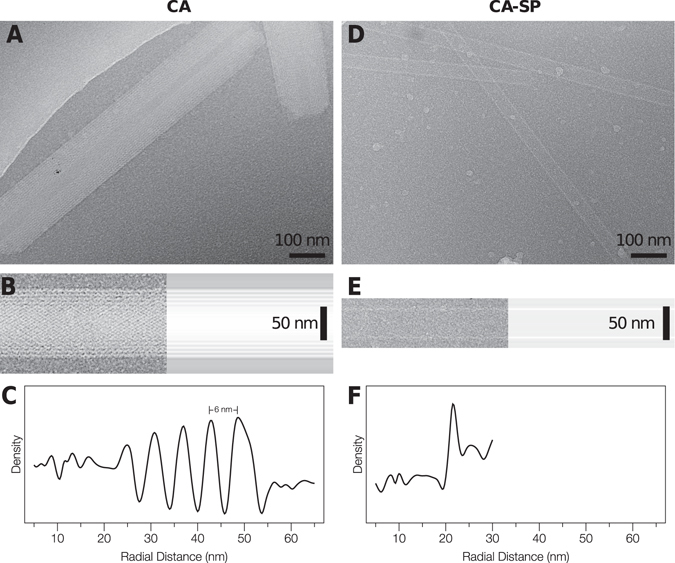
RSV CA and CA-SP Tubes imaged using Cryo-EM. (A) and (D) Images of tubes suspended in vitreous ice. (B) and (E) Image of a tube (left), together with the longitudinally-averaged image of the same tube (right). (C) and (F) Mean radial density profiles for the tubes shown in (B) and (E) respectively. These were obtained from the longitudinally-averaged projection image via the inverse Abel transform. For this analysis, the images were not corrected for the effects of the contrast transfer function.