
Figure 2.
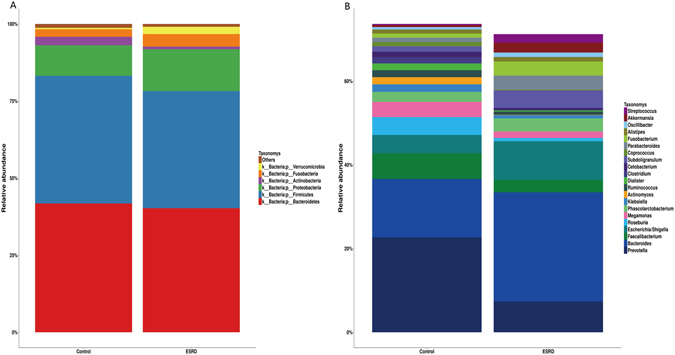
Relative abundance of the gut microbiota in this study. Microbiome composition in human from controls (n = 26) or patients with ESRD (n = 27). The composition is based on 16S rRNA sequecing. Results are shown at the (A) phylum and (B) genus level. The figure shows species median relative abundance >= 1% of total abundance in either the healthy control group or the ESRD group, and value < 1%, unclassified, unidentified are classified as Others.