
Figure 4.
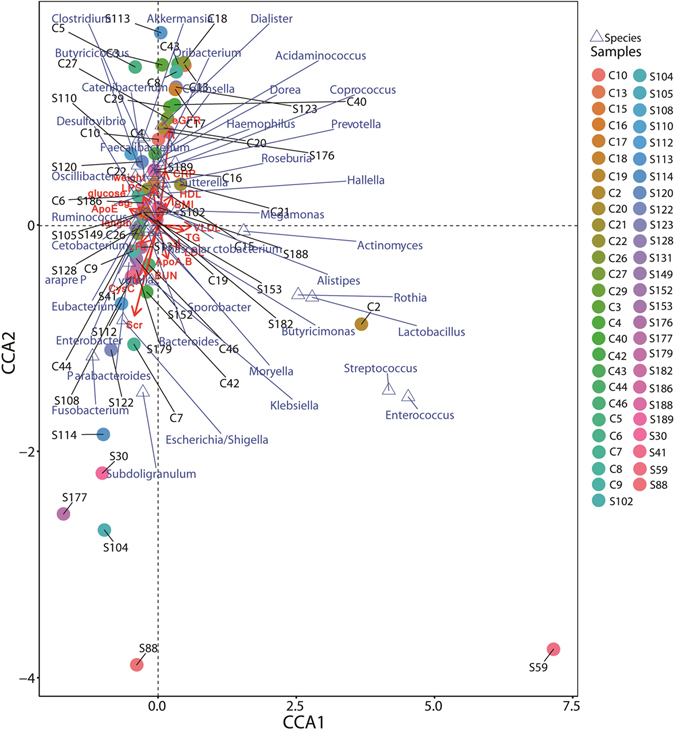
Canonical Correspondence Analysis (CCA) illustrating relations between bacteria taxa and internal environmental parameters accumulated in healthy controls and patients with ESRD in China. Arrows indicate the direction and magnitude of internal environmental parameters associated with bacterial community structure. The explained variance of the principal axes [Axis 1 (horizontally) and Axis 2 (vertically)] are 9.319% and 6.008%, respectively; The species explained 39.82% of the total information amount. The filled circle represents samples, triangle represents species. S* and C* represent ESRD patients and healthy controls respectively.