Fig. 1.

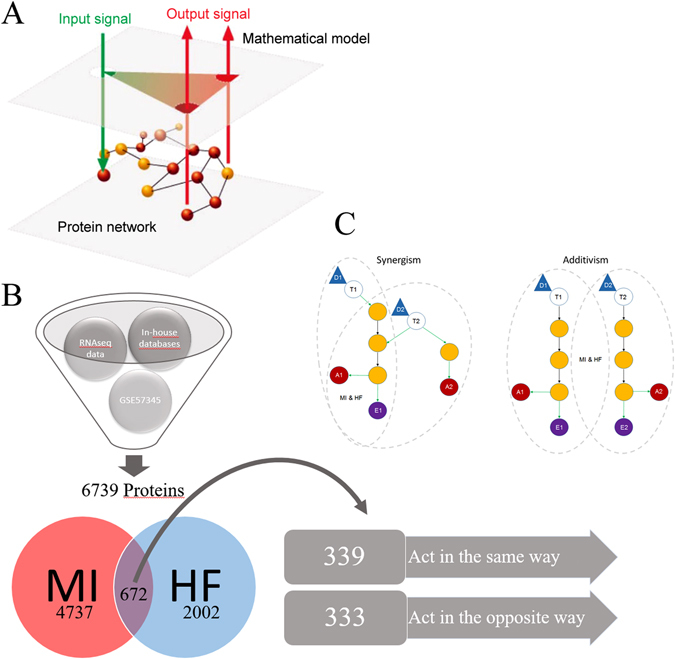
Schematic representation of the mathematical model workflow. a Illustration of the input/output data flow. Once all the information is available around Sacubitril/Valsartan targets (eg. Drugbank), the pathophysiology of both conditions (MI and HF) (input signals, green arrows) and its links to cardiac remodeling (output signals; red arrows) have been identified and characterized at the protein level, the protein network is built. Then the models are trained with all this information and emit how the system is more likely to respond at the protein level (whether by up-regulation or down-regulation) after a certain treatment. Thus, we can elucidate one MoA that is able to explain how the system goes from the stimulus (input) to the observable clinical response (output). b Depiction of data processing using TPMS technology. c Synergism/additivism schemes. Triangular shapes represent drug administration. Void circles act as the drug targets. Yellow circles represent downstream proteins participating on the cascade. Red and purple circles refer to different types of effects. Gray dotted-line patterns show the pathways of each condition, marking if there is a common share. MI myocardial infarction, HF Heart Failure
