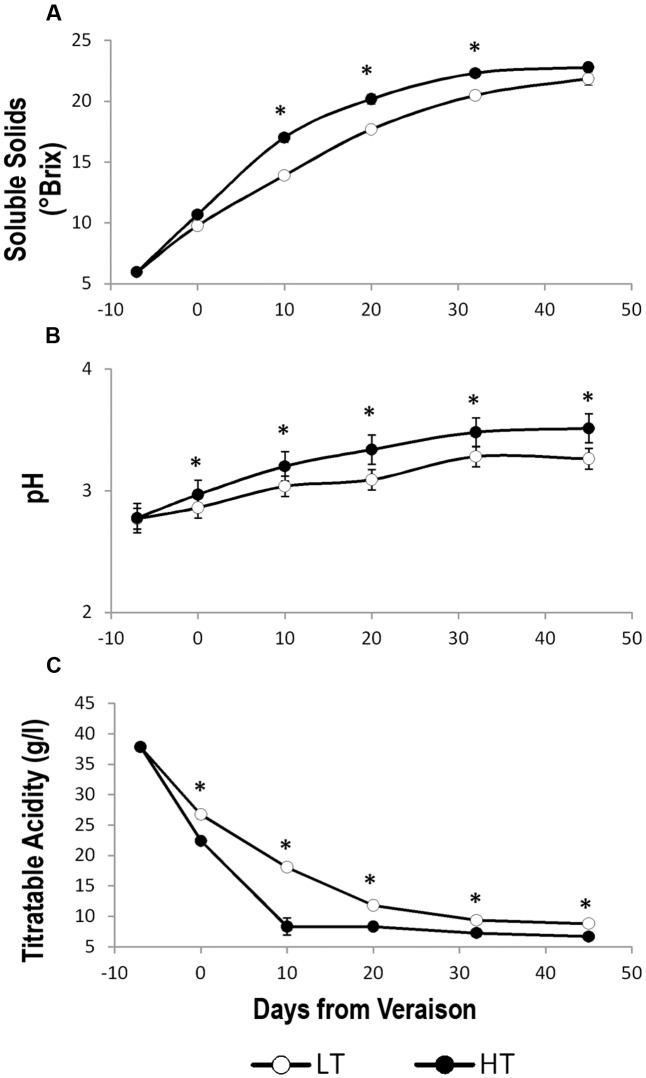
FIGURE 2.
Trends of the main berry ripening parameters under different temperature regimes. Trends of (A) soluble solids (°Brix), (B) pH, and (C) titratable acidity in grape berry samples grown under two different temperature regimes. LT = low temperature = white symbol, HT = high temperature = black symbol. Bars represent ± SE (n = 4). Asterisks indicate significant differences between HT and LT at the same date using ANOVA (∗P < 0.05).

