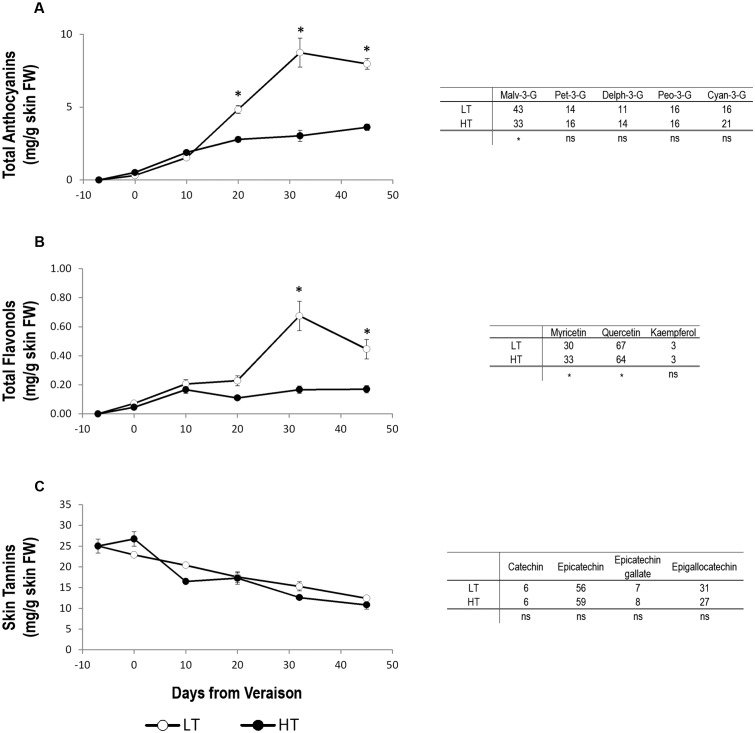
FIGURE 3.
Concentration trends and relative composition of the main flavonoid compounds at harvest. Total concentration trends (left panels) and relative composition at harvest (right tables) of anthocyanins (A), flavonols (B), and skin tannins (C) in grape berry samples grown under two different temperature regimes. LT = low temperature = white symbol, HT = high temperature = black symbol. Bars represent ± SE (n = 4). Asterisks indicate significant differences between HT and LT at the same date using ANOVA (∗P < 0.05). ns, not significant.

