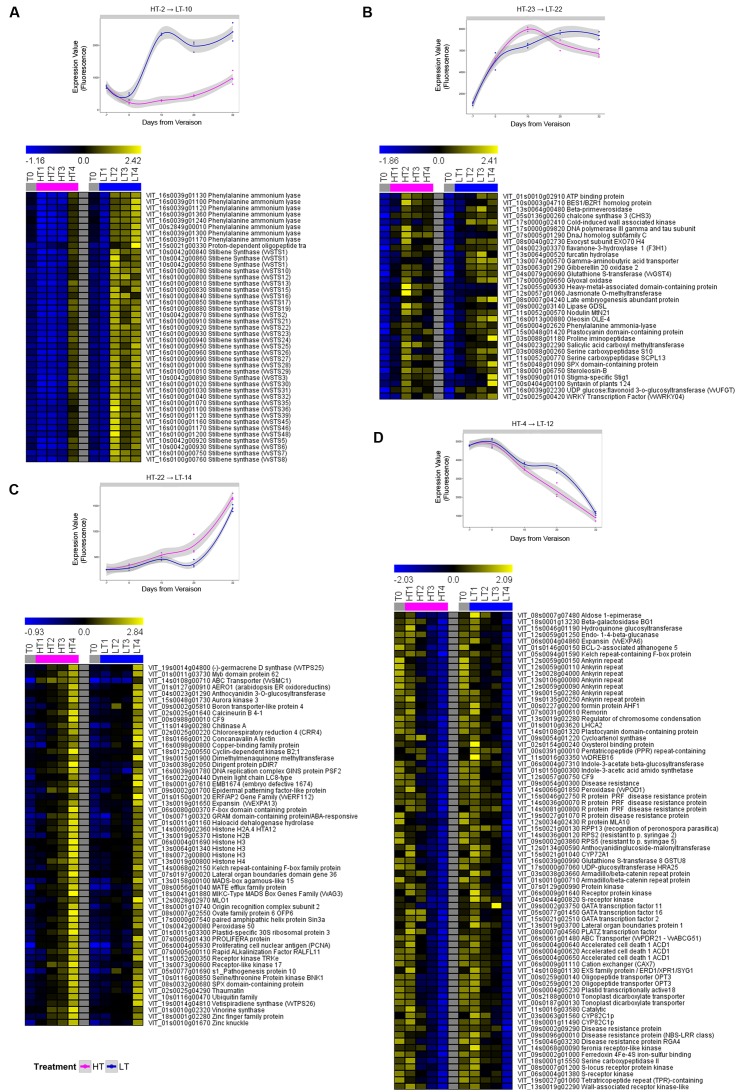
FIGURE 5.
Growing temperature regime affects specific clusters of genes. Four selected significant profiles (<5% Bonferroni correction method) of the 2,257 genes modulated in different growing temperature, from among 25 profiles obtained by STEM analysis. For each cluster, the average gene expression trend (top panels) and heat map of all the genes’ expression profiles (bottom panels) are depicted. See Supplementary File 3 for the complete comparison profile table and clusters numbering. (A) HT 2 → LT 10, (B) HT 23 → LT 22, (C) HT 22 → LT 14, (D) HT 4 → LT 12. T0 = plants before treatment, LT = low temperature, HT = high temperature. Sample names are composed by temperature treatment abbreviation followed by the indication of the developmental stage (1, 2, 3 or 4). Data are the average of the three biological replicates. Gray, blue, and purple indicate samples of control, LT-treated and HT-treated, respectively.

