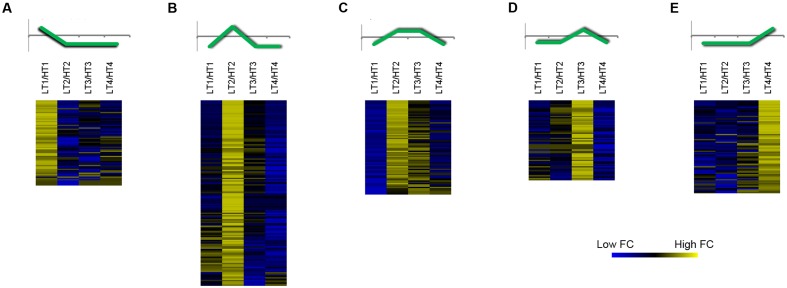
FIGURE 6.
Clustering analysis of the most differently expressed genes between Low (LT) and High (HT) growing temperature regime. Heat maps of the Fold Change (FC) of highly expressed (threshold value of raw fluorescence intensity ≥ 100) and modulated genes (|FC| ≥ 2) between LT and HT in at least one stage of development. Five clusters (A–E) were obtained by applying a K-Means Clustering analysis (KMC, Pearson’s correlation distance). A schematic representation of the general FC trend is depicted on top of each cluster heat map. Sample names are composed by temperature treatment abbreviation followed by the indication of the developmental stage (1, 2, 3 or 4). Data are the average of the three biological replicates.

